User Manual
Page 1
Tables Matrices Beyond the Basics Inferential statistics Programming More Information Sending and receiving Formulas Graphing a function Modes Lists Data and lists Split screen Archiving/Unarchiving Menu maps Troubleshooting Support and service © 2001-2003 Texas Instruments TI TI-83 Plus / TI-83 Plus Silver Edition Graphing Calculator Guidebook 07/23/03 First Steps On/Off Menus Using parentheses Creating...
Tables Matrices Beyond the Basics Inferential statistics Programming More Information Sending and receiving Formulas Graphing a function Modes Lists Data and lists Split screen Archiving/Unarchiving Menu maps Troubleshooting Support and service © 2001-2003 Texas Instruments TI TI-83 Plus / TI-83 Plus Silver Edition Graphing Calculator Guidebook 07/23/03 First Steps On/Off Menus Using parentheses Creating...
User Manual
Page 5
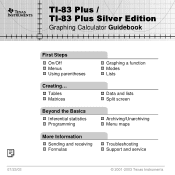
TI-83 Plus Keyboard Generally, the keyboard is divided into these zones: graphing keys, editing keys, advanced function keys, and scientific calculator keys. Keyboard Zones Graphing - Scientific - Editing - Advanced - TI-83 Plus Operating the TI-83 Plus Silver Edition 2 Advanced function keys display menus that access the advanced functions. Editing keys allow you to edit expressions and values. Scientific calculator keys access the capabilities of a standard scientific calculator. Graphing keys access the interactive graphing features.
TI-83 Plus Keyboard Generally, the keyboard is divided into these zones: graphing keys, editing keys, advanced function keys, and scientific calculator keys. Keyboard Zones Graphing - Scientific - Editing - Advanced - TI-83 Plus Operating the TI-83 Plus Silver Edition 2 Advanced function keys display menus that access the advanced functions. Editing keys allow you to edit expressions and values. Scientific calculator keys access the capabilities of a standard scientific calculator. Graphing keys access the interactive graphing features.
User Manual
Page 6
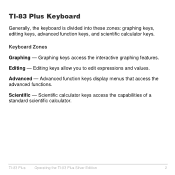
TI-83 Plus Graphing Keys Editing Keys Advanced Function Keys Scientific Calculator Keys Colors may vary in actual product. TI-83 Plus Operating the TI-83 Plus Silver Edition 3
TI-83 Plus Graphing Keys Editing Keys Advanced Function Keys Scientific Calculator Keys Colors may vary in actual product. TI-83 Plus Operating the TI-83 Plus Silver Edition 3
User Manual
Page 7
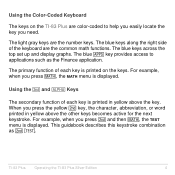
... keys along the right side of the keyboard are the number keys. When you press , the MATH menu is displayed. TI-83 Plus Operating the TI-83 Plus Silver Edition 4 The primary function of each key is printed in yellow above the key. For example, when you need. The blue keys... across the top set up and display graphs. This guidebook describes this keystroke combination as the Finance application. Using the Color.Coded ...
... keys along the right side of the keyboard are the number keys. When you press , the MATH menu is displayed. TI-83 Plus Operating the TI-83 Plus Silver Edition 4 The primary function of each key is printed in yellow above the key. For example, when you need. The blue keys... across the top set up and display graphs. This guidebook describes this keystroke combination as the Finance application. Using the Color.Coded ...
User Manual
Page 13
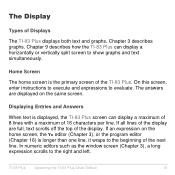
... of Displays The TI-83 Plus displays both text and graphs. If all lines of the display are displayed on the home screen, the Y= editor (Chapter 3), or the program editor (Chapter 16) is displayed, the TI-83 Plus screen can display a horizontally or vertically split screen to the beginning of the TI-83 Plus. TI-83 Plus Operating the TI-83 Plus Silver Edition 10 The Display...
... of Displays The TI-83 Plus displays both text and graphs. If all lines of the display are displayed on the home screen, the Y= editor (Chapter 3), or the program editor (Chapter 16) is displayed, the TI-83 Plus screen can display a horizontally or vertically split screen to the beginning of the TI-83 Plus. TI-83 Plus Operating the TI-83 Plus Silver Edition 10 The Display...
User Manual
Page 14
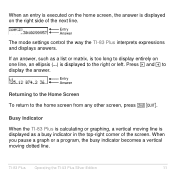
If an answer, such as a busy indicator in the top-right corner of the next line. TI-83 Plus Operating the TI-83 Plus Silver Edition 11 Press ~ and | to the home screen from any other screen, press y 5. When you pause a graph or a program, the busy indicator becomes a vertical moving line is displayed as a list or matrix, is displayed...
If an answer, such as a busy indicator in the top-right corner of the next line. TI-83 Plus Operating the TI-83 Plus Silver Edition 11 Press ~ and | to the home screen from any other screen, press y 5. When you pause a graph or a program, the busy indicator becomes a vertical moving line is displayed as a list or matrix, is displayed...
User Manual
Page 15
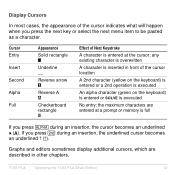
...a 2nd operation is executed An alpha character (green on the keyboard) is entered or SOLVE is executed No entry; TI-83 Plus Operating the TI-83 Plus Silver Edition 12 Cursor Entry Insert Second Alpha Full Appearance Solid rectangle $ Underline __ Reverse arrow Þ Reverse A Ø ...Checkerboard rectangle # Effect of Next Keystroke A character is entered at a prompt or memory is inserted in other chapters. Graphs and editors...
...a 2nd operation is executed An alpha character (green on the keyboard) is entered or SOLVE is executed No entry; TI-83 Plus Operating the TI-83 Plus Silver Edition 12 Cursor Entry Insert Second Alpha Full Appearance Solid rectangle $ Underline __ Reverse arrow Þ Reverse A Ø ...Checkerboard rectangle # Effect of Next Keystroke A character is entered at a prompt or memory is inserted in other chapters. Graphs and editors...
User Manual
Page 19
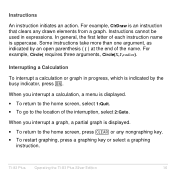
... the name. Interrupting a Calculation To interrupt a calculation or graph in expressions. For example, ClrDraw is indicated by an open parenthesis ( ( ) at the end of each instruction name is displayed. • To return to the location of the interruption, select 2:Goto. TI-83 Plus Operating the TI-83 Plus Silver Edition 16 Instructions An instruction initiates an action. For...
... the name. Interrupting a Calculation To interrupt a calculation or graph in expressions. For example, ClrDraw is indicated by an open parenthesis ( ( ) at the end of each instruction name is displayed. • To return to the location of the interruption, select 2:Goto. TI-83 Plus Operating the TI-83 Plus Silver Edition 16 Instructions An instruction initiates an action. For...

User Manual
Page 110
... always necessary. 1. Press o and enter, edit, or select one or more functions in any graphing mode, follow these steps. Press z and set the appropriate graph mode. 2. Set the graph style for each function. 5. and select the graph format settings. TI-83 Plus Function Graphing 107 Some steps are unique to parametric graphing, polar graphing, and sequence graphing. Press y . Deselect stat plots, if...
... always necessary. 1. Press o and enter, edit, or select one or more functions in any graphing mode, follow these steps. Press z and set the appropriate graph mode. 2. Set the graph style for each function. 5. and select the graph format settings. TI-83 Plus Function Graphing 107 Some steps are unique to parametric graphing, polar graphing, and sequence graphing. Press y . Deselect stat plots, if...

User Manual
Page 117
... display the Y= editor. 2. When you enter or edit a function, it is selected automatically. Selecting and Deselecting Functions Selecting and Deselecting a Function You can select any or all functions Y1 through Y9, and Y0. You can select and deselect (turn on the function's = sign. 4. TI-83 Plus Function Graphing 114 Press o to select or deselect. 3. Press... in the Y= editor. Press | to change the selection status. When you clear a function, it is deselected. A function is selected when the = sign is highlighted. The TI-83 Plus graphs only the selected functions.
... display the Y= editor. 2. When you enter or edit a function, it is selected automatically. Selecting and Deselecting Functions Selecting and Deselecting a Function You can select any or all functions Y1 through Y9, and Y0. You can select and deselect (turn on the function's = sign. 4. TI-83 Plus Function Graphing 114 Press o to select or deselect. 3. Press... in the Y= editor. Press | to change the selection status. When you clear a function, it is deselected. A function is selected when the = sign is highlighted. The TI-83 Plus graphs only the selected functions.
User Manual
Page 161
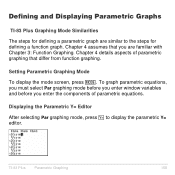
... Displaying Parametric Graphs TI-83 Plus Graphing Mode Similarities The steps for defining a function graph. To graph parametric equations, you must select Par graphing mode before you enter window variables and before you are similar to display the parametric Y= editor. Setting Parametric Graphing Mode To display the mode screen, press z. Chapter 4 details aspects of parametric equations. TI-83 Plus Parametric Graphing 158 Displaying...
... Displaying Parametric Graphs TI-83 Plus Graphing Mode Similarities The steps for defining a function graph. To graph parametric equations, you must select Par graphing mode before you enter window variables and before you are similar to display the parametric Y= editor. Setting Parametric Graphing Mode To display the mode screen, press z. Chapter 4 details aspects of parametric equations. TI-83 Plus Parametric Graphing 158 Displaying...

User Manual
Page 163
...both the X and Y components is selected when the = signs of both the X and Y components are defaults for Par graphing in Radian angle mode. TI-83 Plus Parametric Graphing 160 Xmin=L10 Xmax=10 Xscl=1 Ymin=L10 Ymax=10 Yscl=1 Smallest T value to evaluate Largest T value to evaluate (2p... move the cursor onto the = sign of the equations X1T and Y1T through X6T and Y6T. Selecting and Deselecting Parametric Equations The TI-83 Plus graphs only the selected parametric equations. Setting Window Variables To display the window variable values, press p. In the Y= editor, a parametric ...
...both the X and Y components is selected when the = signs of both the X and Y components are defaults for Par graphing in Radian angle mode. TI-83 Plus Parametric Graphing 160 Xmin=L10 Xmax=10 Xscl=1 Ymin=L10 Ymax=10 Yscl=1 Smallest T value to evaluate Largest T value to evaluate (2p... move the cursor onto the = sign of the equations X1T and Y1T through X6T and Y6T. Selecting and Deselecting Parametric Equations The TI-83 Plus graphs only the selected parametric equations. Setting Window Variables To display the window variable values, press p. In the Y= editor, a parametric ...

User Manual
Page 171
... steps for defining a function graph. To graph polar equations, you must select Pol graphing mode before you enter values for the window variables and before you are similar to display the polar Y= editor. Setting Polar Graphing Mode To display the mode screen, press z. TI-83 Plus Polar Graphing 168 Defining and Displaying Polar Graphs TI-83 Plus Graphing Mode Similarities The steps for...
... steps for defining a function graph. To graph polar equations, you must select Pol graphing mode before you enter values for the window variables and before you are similar to display the polar Y= editor. Setting Polar Graphing Mode To display the mode screen, press z. TI-83 Plus Polar Graphing 168 Defining and Displaying Polar Graphs TI-83 Plus Graphing Mode Similarities The steps for...

User Manual
Page 172
...), ë (path), ì (animate), and í (dot) styles are available for defining a function or editing a function. Selecting and Deselecting Polar Equations The TI-83 Plus graphs only the selected polar equations. In the Y= editor, a polar equation is selected when the = sign is ç...; Press ƒ ãqä. Selecting Graph Styles The icons to six polar equations, r1 through r6 represent the graph style of the independent variable q. TI-83 Plus Polar Graphing 169 Defining and Editing Polar Equations To define or edit a polar equation, follow the steps in terms...
...), ë (path), ì (animate), and í (dot) styles are available for defining a function or editing a function. Selecting and Deselecting Polar Equations The TI-83 Plus graphs only the selected polar equations. In the Y= editor, a polar equation is selected when the = sign is ç...; Press ƒ ãqä. Selecting Graph Styles The icons to six polar equations, r1 through r6 represent the graph style of the independent variable q. TI-83 Plus Polar Graphing 169 Defining and Editing Polar Equations To define or edit a polar equation, follow the steps in terms...

User Manual
Page 182
... current plotting-order mode setting. Setting Sequence Graphing Mode To display the mode screen, press z. TI-83 Plus Sequence Graphing 179 Defining and Displaying Sequence Graphs TI-83 Plus Graphing Mode Similarities The steps for defining a sequence graph are above the ¬, −, and ® keys. Sequence graphs automatically plot in Simul mode, regardless of sequence graphing that differ from the keyboard: u, v, and...
... current plotting-order mode setting. Setting Sequence Graphing Mode To display the mode screen, press z. TI-83 Plus Sequence Graphing 179 Defining and Displaying Sequence Graphs TI-83 Plus Graphing Mode Similarities The steps for defining a sequence graph are above the ¬, −, and ® keys. Sequence graphs automatically plot in Simul mode, regardless of sequence graphing that differ from the keyboard: u, v, and...

User Manual
Page 184
Selecting and Deselecting Sequence Functions The TI-83 Plus graphs only the selected sequence functions. If you enter a new value for nMin in one editor, the new value for sequence graphing. Dot, ç (line), and è (thick) styles are highlighted. TI-83 Plus Sequence Graphing 181 In the Y= editor, a sequence function is selected when the = signs of both u(n)= and u(nMin...
Selecting and Deselecting Sequence Functions The TI-83 Plus graphs only the selected sequence functions. If you enter a new value for nMin in one editor, the new value for sequence graphing. Dot, ç (line), and è (thick) styles are highlighted. TI-83 Plus Sequence Graphing 181 In the Y= editor, a sequence function is selected when the = signs of both u(n)= and u(nMin...

User Manual
Page 798
..., or, xor 103 not 104 Using Boolean Operations 104 Chapter 3: Function Graphing 105 Getting Started: Graphing a Circle 105 Defining Graphs 107 TI-83 Plus-Graphing Mode Similarities 107 Defining a Graph 107 Displaying and Exploring a Graph 108 Saving a Graph for Later Use 108 Setting the Graph Modes 109 Checking and Changing the Graphing Mode 109 Setting Modes from a Program 110 Defining Functions 111...
..., or, xor 103 not 104 Using Boolean Operations 104 Chapter 3: Function Graphing 105 Getting Started: Graphing a Circle 105 Defining Graphs 107 TI-83 Plus-Graphing Mode Similarities 107 Defining a Graph 107 Displaying and Exploring a Graph 108 Saving a Graph for Later Use 108 Setting the Graph Modes 109 Checking and Changing the Graphing Mode 109 Setting Modes from a Program 110 Defining Functions 111...

User Manual
Page 801
... the CALC (Calculate) Operations 147 CALCULATE Menu 147 value 147 zero 148 minimum, maximum 150 intersect 151 dy/dx 152 ‰f(x)dx 153 Chapter 4: Parametric Graphing 154 Getting Started: Path of a Ball 154 Defining and Displaying Parametric Graphs 158 TI-83 Plus Graphing Mode Similarities 158 Setting Parametric Graphing Mode 158 TI-83 Plus Quick-Find Locator x
... the CALC (Calculate) Operations 147 CALCULATE Menu 147 value 147 zero 148 minimum, maximum 150 intersect 151 dy/dx 152 ‰f(x)dx 153 Chapter 4: Parametric Graphing 154 Getting Started: Path of a Ball 154 Defining and Displaying Parametric Graphs 158 TI-83 Plus Graphing Mode Similarities 158 Setting Parametric Graphing Mode 158 TI-83 Plus Quick-Find Locator x

User Manual
Page 802
... Defining and Displaying Polar Graphs 168 TI-83 Plus Graphing Mode Similarities 168 Setting Polar Graphing Mode 168 Displaying the Polar Y= Editor 168 Selecting Graph Styles 169 Defining and Editing Polar Equations 169 Selecting and Deselecting Polar Equations 169 Setting Window Variables 170 Setting the Graph Format 171 Displaying a Graph 171 Window Variables and Y.VARS Menus 171 TI-83 Plus Quick-Find Locator...
... Defining and Displaying Polar Graphs 168 TI-83 Plus Graphing Mode Similarities 168 Setting Polar Graphing Mode 168 Displaying the Polar Y= Editor 168 Selecting Graph Styles 169 Defining and Editing Polar Equations 169 Selecting and Deselecting Polar Equations 169 Setting Window Variables 170 Setting the Graph Format 171 Displaying a Graph 171 Window Variables and Y.VARS Menus 171 TI-83 Plus Quick-Find Locator...

User Manual
Page 803
... Getting Started: Forest and Trees 176 Defining and Displaying Sequence Graphs 179 TI-83 Plus Graphing Mode Similarities 179 Setting Sequence Graphing Mode 179 TI-83 Plus Sequence Functions u, v, and w 179 Displaying the Sequence Y= Editor 180 Selecting Graph Styles 181 Selecting and Deselecting Sequence Functions 181 Defining and Editing a Sequence Function 182 Nonrecursive Sequences 182 Recursive Sequences 183 Setting Window Variables...
... Getting Started: Forest and Trees 176 Defining and Displaying Sequence Graphs 179 TI-83 Plus Graphing Mode Similarities 179 Setting Sequence Graphing Mode 179 TI-83 Plus Sequence Functions u, v, and w 179 Displaying the Sequence Y= Editor 180 Selecting Graph Styles 181 Selecting and Deselecting Sequence Functions 181 Defining and Editing a Sequence Function 182 Nonrecursive Sequences 182 Recursive Sequences 183 Setting Window Variables...


