
User Manual
Page 132
...stop graphing. • Press Í to redraw. then press s to pause; TI-83 Plus Function Graphing 129 As the TI-83 Plus plots the graph, the busy indicator is plotted, X and Y are updated. As the graph is on. Smart Graph Smart Graph is a TI-83 Plus feature that would cause replotting have remained the same since the graph... TRACE, ZOOM instructions, and CALC operations display the graph automatically. Pausing or Stopping a Graph While plotting a graph, you press s, but only if all graphing factors that redisplays the last graph immediately when you can pause or stop ;
...stop graphing. • Press Í to redraw. then press s to pause; TI-83 Plus Function Graphing 129 As the TI-83 Plus plots the graph, the busy indicator is plotted, X and Y are updated. As the graph is on. Smart Graph Smart Graph is a TI-83 Plus feature that would cause replotting have remained the same since the graph... TRACE, ZOOM instructions, and CALC operations display the graph automatically. Pausing or Stopping a Graph While plotting a graph, you press s, but only if all graphing factors that redisplays the last graph immediately when you can pause or stop ;
User Manual
Page 147
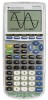
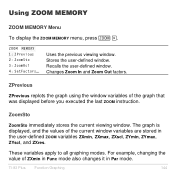
Stores the user-defined window. For example, changing the value of the current window variables are stored in Par mode. Uses the previous viewing window. TI-83 Plus Function Graphing 144 The graph is displayed, and the values of ZXmin in Func mode also changes it in the user-defined ZOOM variables ZXmin, ... variables of the graph that was displayed before you executed the last ZOOM instruction. Recalls the user-defined window. Changes Zoom In and Zoom Out factors.
Stores the user-defined window. For example, changing the value of the current window variables are stored in Par mode. Uses the previous viewing window. TI-83 Plus Function Graphing 144 The graph is displayed, and the values of ZXmin in Func mode also changes it in the user-defined ZOOM variables ZXmin, ... variables of the graph that was displayed before you executed the last ZOOM instruction. Recalls the user-defined window. Changes Zoom In and Zoom Out factors.
User Manual
Page 148
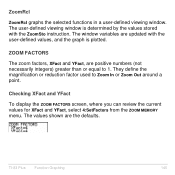
... YFact, are updated with the ZoomSto instruction. ZoomRcl ZoomRcl graphs the selected functions in a user-defined viewing window. They define the magnification or reduction factor used to 1. TI-83 Plus Function Graphing 145 The window variables are positive numbers (not necessarily integers) greater than or equal to Zoom In or Zoom Out around a point...
... YFact, are updated with the ZoomSto instruction. ZoomRcl ZoomRcl graphs the selected functions in a user-defined viewing window. They define the magnification or reduction factor used to 1. TI-83 Plus Function Graphing 145 The window variables are positive numbers (not necessarily integers) greater than or equal to Zoom In or Zoom Out around a point...
User Manual
Page 559
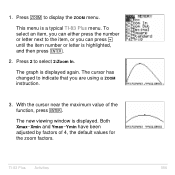
... q to select 2:Zoom In. The cursor has changed to the item, or you are using a ZOOM instruction. 3. Both XmaxNXmin and YmaxNYmin have been adjusted by factors of the function, press Í. This menu is displayed. TI-83 Plus Activities 556 With the cursor near the maximum value of 4, the default values for the zoom...
... q to select 2:Zoom In. The cursor has changed to the item, or you are using a ZOOM instruction. 3. Both XmaxNXmin and YmaxNYmin have been adjusted by factors of the function, press Í. This menu is displayed. TI-83 Plus Activities 556 With the cursor near the maximum value of 4, the default values for the zoom...

User Manual
Page 571
Enter the functions. 2. Press z. TI-83 Plus Activities 568 Solving a System of two equations and two unknowns: Y = X3N2X and Y = 2cos(X). Use ZOOM factors to intersect). The display shows that two solutions may exist (points where the two functions appear to control the decimal places displayed on the graph. Stated another way, solve the system of Nonlinear Equations Problem Using a graph, solve the equation X3 N 2X = 2cos(X). Press o. Procedure 1. Select the default mode settings. Turn off all functions and stat plots. Press q 4 to select 4:ZDecimal.
Enter the functions. 2. Press z. TI-83 Plus Activities 568 Solving a System of two equations and two unknowns: Y = X3N2X and Y = 2cos(X). Use ZOOM factors to intersect). The display shows that two solutions may exist (points where the two functions appear to control the decimal places displayed on the graph. Stated another way, solve the system of Nonlinear Equations Problem Using a graph, solve the equation X3 N 2X = 2cos(X). Press o. Procedure 1. Select the default mode settings. Turn off all functions and stat plots. Press q 4 to select 4:ZDecimal.

User Manual
Page 703
q ZOOM MEMORY MEMORY 1:ZBox 2:Zoom In 3:Zoom Out 4:ZDecimal 5:ZSquare 1:ZPrevious 2:ZoomSto 3:ZoomRcl 4:SetFactors... (Set Factors...) ZOOM FACTORS XFact=4 YFact=4 6:ZStandard 7:ZTrig 8:ZInteger 9:ZoomStat 0:ZoomFit y . (Func/Par/Pol modes) (Seq mode) RectGC PolarGC Time Web uv vw uw CoordOn CoordOff RectGC PolarGC GridOff GridOn CoordOn CoordOff AxesOn AxesOff GridOff GridOn LabelOff LabelOn AxesOn AxesOff ExprOn ExprOff LabelOff LabelOn ExprOn ExprOff TI-83 Plus Tables and Reference Information 700
q ZOOM MEMORY MEMORY 1:ZBox 2:Zoom In 3:Zoom Out 4:ZDecimal 5:ZSquare 1:ZPrevious 2:ZoomSto 3:ZoomRcl 4:SetFactors... (Set Factors...) ZOOM FACTORS XFact=4 YFact=4 6:ZStandard 7:ZTrig 8:ZInteger 9:ZoomStat 0:ZoomFit y . (Func/Par/Pol modes) (Seq mode) RectGC PolarGC Time Web uv vw uw CoordOn CoordOff RectGC PolarGC GridOff GridOn CoordOn CoordOff AxesOn AxesOff GridOff GridOn LabelOff LabelOn AxesOn AxesOff ExprOn ExprOff LabelOff LabelOn ExprOn ExprOff TI-83 Plus Tables and Reference Information 700

User Manual
Page 726
The mean squares (MS) that make up Û are: Factor MS = FactorSS Factordf Error MS = ErrorSS Errordf The sum of squares (SS) that make up the mean squares are: I ∑ Factor SS = ni(xi − x)2 i=1 I ∑ Error SS = (ni − 1)Sxi2 i=1 The degrees of freedom df that make up the mean squares are: Factordf = I − 1 = numeratordf for Û I Error df = ∑(ni −1) = denominatordf for Û i=1 TI-83 Plus Tables and Reference Information 723
The mean squares (MS) that make up Û are: Factor MS = FactorSS Factordf Error MS = ErrorSS Errordf The sum of squares (SS) that make up the mean squares are: I ∑ Factor SS = ni(xi − x)2 i=1 I ∑ Error SS = (ni − 1)Sxi2 i=1 The degrees of freedom df that make up the mean squares are: Factordf = I − 1 = numeratordf for Û I Error df = ∑(ni −1) = denominatordf for Û i=1 TI-83 Plus Tables and Reference Information 723

User Manual
Page 790
... -Y- x‡ (root), 69, 693 XFact zoom factor, 145 x-intercept of a list), 314, 689 VARS menu GDB, 44 Picture, 44 Statistics, 44 String, 44 Table, 44 Window, 44 Zoom, 44 Vertical (draw line), 221, 689 viewing window, 121 Volt, 468 Voltage, 468 Volt-Time, 468 TI-83 Plus Index vw/uvAxes (axes format), 187, 689...
... -Y- x‡ (root), 69, 693 XFact zoom factor, 145 x-intercept of a list), 314, 689 VARS menu GDB, 44 Picture, 44 Statistics, 44 String, 44 Table, 44 Window, 44 Zoom, 44 Vertical (draw line), 221, 689 viewing window, 121 Volt, 468 Voltage, 468 Volt-Time, 468 TI-83 Plus Index vw/uvAxes (axes format), 187, 689...

User Manual
Page 791
..., 143, 690 ZInterval (one-sample z confidence interval), 405, 690 zoom, 138, 139, 140, 141, 142, 143, 144, 145, 146 cursor, 139 factors, 145 function graphing, 138 parametric graphing, 165 polar graphing, 174 sequence graphing, 191 Zoom In (zoom in), 140, 690 ZOOM MEMORY menu, 144 ZOOM menu...use previous window), 144, 691 ZSquare (set square pixels), 142, 691 ZStandard (use standard window), 142, 691 ZTrig (trigonometric window), 142, 692 TI-83 Plus Index 788 Y= editor function graphing, 111 parametric graphing, 158 polar graphing, 168 sequence graphing, 180 YFact zoom factor, 145 -Z-
..., 143, 690 ZInterval (one-sample z confidence interval), 405, 690 zoom, 138, 139, 140, 141, 142, 143, 144, 145, 146 cursor, 139 factors, 145 function graphing, 138 parametric graphing, 165 polar graphing, 174 sequence graphing, 191 Zoom In (zoom in), 140, 690 ZOOM MEMORY menu, 144 ZOOM menu...use previous window), 144, 691 ZSquare (set square pixels), 142, 691 ZStandard (use standard window), 142, 691 ZTrig (trigonometric window), 142, 692 TI-83 Plus Index 788 Y= editor function graphing, 111 parametric graphing, 158 polar graphing, 168 sequence graphing, 180 YFact zoom factor, 145 -Z-

User Manual
Page 801
ZTrig 142 ZInteger 143 ZoomStat 143 ZoomFit 143 Using ZOOM MEMORY 144 ZOOM MEMORY Menu 144 ZPrevious 144 ZoomSto 144 ZoomRcl 145 ZOOM FACTORS 145 Checking XFact and YFact 145 Changing XFact and YFact 146 Using ZOOM MEMORY Menu Items from the Home Screen or a Program 146 Using the ... 150 intersect 151 dy/dx 152 ‰f(x)dx 153 Chapter 4: Parametric Graphing 154 Getting Started: Path of a Ball 154 Defining and Displaying Parametric Graphs 158 TI-83 Plus Graphing Mode Similarities 158 Setting Parametric Graphing Mode 158...
ZTrig 142 ZInteger 143 ZoomStat 143 ZoomFit 143 Using ZOOM MEMORY 144 ZOOM MEMORY Menu 144 ZPrevious 144 ZoomSto 144 ZoomRcl 145 ZOOM FACTORS 145 Checking XFact and YFact 145 Changing XFact and YFact 146 Using ZOOM MEMORY Menu Items from the Home Screen or a Program 146 Using the ... 150 intersect 151 dy/dx 152 ‰f(x)dx 153 Chapter 4: Parametric Graphing 154 Getting Started: Path of a Ball 154 Defining and Displaying Parametric Graphs 158 TI-83 Plus Graphing Mode Similarities 158 Setting Parametric Graphing Mode 158...


