User Manual
Page 1
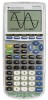
TI TI-83 Plus / TI-83 Plus Silver Edition Graphing Calculator Guidebook 07/23/03 First Steps On/Off Menus Using parentheses Creating... Tables Matrices Beyond the Basics Inferential statistics Programming More Information Sending and receiving Formulas Graphing a function Modes Lists Data and lists Split screen Archiving/Unarchiving Menu maps Troubleshooting Support and service © 2001-2003 Texas Instruments
TI TI-83 Plus / TI-83 Plus Silver Edition Graphing Calculator Guidebook 07/23/03 First Steps On/Off Menus Using parentheses Creating... Tables Matrices Beyond the Basics Inferential statistics Programming More Information Sending and receiving Formulas Graphing a function Modes Lists Data and lists Split screen Archiving/Unarchiving Menu maps Troubleshooting Support and service © 2001-2003 Texas Instruments
User Manual
Page 5
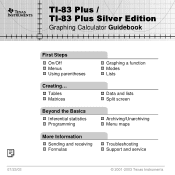
Editing keys allow you to edit expressions and values. Graphing keys access the interactive graphing features. Advanced - Editing - Scientific calculator keys access the capabilities of a standard scientific calculator. TI-83 Plus Keyboard Generally, the keyboard is divided into these zones: graphing keys, editing keys, advanced function keys, and scientific calculator keys. Scientific - TI-83 Plus Operating the TI-83 Plus Silver Edition 2 Advanced function keys display menus that access the advanced functions. Keyboard Zones Graphing -
Editing keys allow you to edit expressions and values. Graphing keys access the interactive graphing features. Advanced - Editing - Scientific calculator keys access the capabilities of a standard scientific calculator. TI-83 Plus Keyboard Generally, the keyboard is divided into these zones: graphing keys, editing keys, advanced function keys, and scientific calculator keys. Scientific - TI-83 Plus Operating the TI-83 Plus Silver Edition 2 Advanced function keys display menus that access the advanced functions. Keyboard Zones Graphing -
User Manual
Page 6
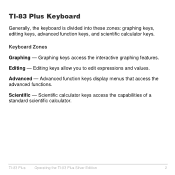
TI-83 Plus Operating the TI-83 Plus Silver Edition 3 TI-83 Plus Graphing Keys Editing Keys Advanced Function Keys Scientific Calculator Keys Colors may vary in actual product.
TI-83 Plus Operating the TI-83 Plus Silver Edition 3 TI-83 Plus Graphing Keys Editing Keys Advanced Function Keys Scientific Calculator Keys Colors may vary in actual product.
User Manual
Page 14
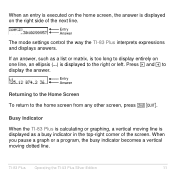
... screen from any other screen, press y 5. TI-83 Plus Operating the TI-83 Plus Silver Edition 11 If an answer, such as a list or matrix, is displayed as a busy indicator in the top-right corner of the next line. Press ~ and | to display the answer. Busy Indicator When the TI-83 Plus is calculating or graphing, a vertical moving dotted line. When you...
... screen from any other screen, press y 5. TI-83 Plus Operating the TI-83 Plus Silver Edition 11 If an answer, such as a list or matrix, is displayed as a busy indicator in the top-right corner of the next line. Press ~ and | to display the answer. Busy Indicator When the TI-83 Plus is calculating or graphing, a vertical moving dotted line. When you...
User Manual
Page 19
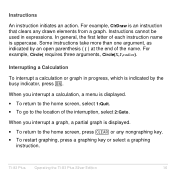
...instruction initiates an action. Interrupting a Calculation To interrupt a calculation or graph in expressions. When you interrupt a calculation, a menu is an instruction that clears any nongraphing key. • To restart graphing, press a graphing key or select a graphing instruction. Instructions cannot be used ...instructions take more than one argument, as indicated by the busy indicator, press É. TI-83 Plus Operating the TI-83 Plus Silver Edition 16 When you interrupt a graph, a partial graph is indicated by an open parenthesis ( ( ) at the end of each instruction name...
...instruction initiates an action. Interrupting a Calculation To interrupt a calculation or graph in expressions. When you interrupt a calculation, a menu is an instruction that clears any nongraphing key. • To restart graphing, press a graphing key or select a graphing instruction. Instructions cannot be used ...instructions take more than one argument, as indicated by the busy indicator, press É. TI-83 Plus Operating the TI-83 Plus Silver Edition 16 When you interrupt a graph, a partial graph is indicated by an open parenthesis ( ( ) at the end of each instruction name...

User Manual
Page 25
... TI-83 Plus Silver Edition 22 Answers display in degrees. Degree mode interprets angle values as radians. The decimal setting applies to these numbers: • An answer displayed on the home screen • Coordinates on a graph (Chapters 3, 4, 5, and 6) • The Tangent( DRAW instruction equation of the line, x, and dy/dx values (Chapter 8) • Results of CALCULATE...
... TI-83 Plus Silver Edition 22 Answers display in degrees. Degree mode interprets angle values as radians. The decimal setting applies to these numbers: • An answer displayed on the home screen • Coordinates on a graph (Chapters 3, 4, 5, and 6) • The Tangent( DRAW instruction equation of the line, x, and dy/dx values (Chapter 8) • Results of CALCULATE...

User Manual
Page 26
... connecting each point calculated for the selected functions. Seq (sequence) graphing mode plots sequences (Chapter 6). Pol (polar) graphing mode plots functions, where r is a function of the selected functions. Dot plotting mode plots only the calculated points of X (Chapter 3). Chapters 3, 4, 5, and 6 describe these modes in detail. TI-83 Plus Operating the TI-83 Plus Silver Edition 23 Func (function) graphing mode plots functions...
... connecting each point calculated for the selected functions. Seq (sequence) graphing mode plots sequences (Chapter 6). Pol (polar) graphing mode plots functions, where r is a function of the selected functions. Dot plotting mode plots only the calculated points of X (Chapter 3). Chapters 3, 4, 5, and 6 describe these modes in detail. TI-83 Plus Operating the TI-83 Plus Silver Edition 23 Func (function) graphing mode plots functions...

User Manual
Page 116
Select the function name, which pastes the name to complete the instruction. Press Í to the cursor location on the home screen or program editor. 5. Yn(value) Yn({value1,value2,value3, . . .,value n}) TI-83 Plus Function Graphing 113 Evaluating Y= Functions in Expressions You can calculate the value of a Y= function Yn at a specified value of values returns a list. "expression"!Yn When the instruction is executed, the TI-83 Plus stores the expression to the designated variable Yn, selects the function, and displays the message Done. A list of X. 4.
Select the function name, which pastes the name to complete the instruction. Press Í to the cursor location on the home screen or program editor. 5. Yn(value) Yn({value1,value2,value3, . . .,value n}) TI-83 Plus Function Graphing 113 Evaluating Y= Functions in Expressions You can calculate the value of a Y= function Yn at a specified value of values returns a list. "expression"!Yn When the instruction is executed, the TI-83 Plus stores the expression to the designated variable Yn, selects the function, and displays the message Done. A list of X. 4.

User Manual
Page 127
... store values to the center of any adjacent pixel on a graph (graphing accuracy). @X and @Y are calculated from Xmin, Xmax, Ymin, and Ymax when you do, Xmax and Ymax are calculated from the center of one pixel to @X and @Y. When the instruction is executed, the TI-83 Plus stores the value to the window variable and displays the...
... store values to the center of any adjacent pixel on a graph (graphing accuracy). @X and @Y are calculated from Xmin, Xmax, Ymin, and Ymax when you do, Xmax and Ymax are calculated from the center of one pixel to @X and @Y. When the instruction is executed, the TI-83 Plus stores the value to the window variable and displays the...

User Manual
Page 138
... entered are displayed in the bottom-left corner of the selected functions in the Y= editor. When the trace cursor moves along a function, the Y value is calculated from function to function, press † and }. The trace cursor moves to Any Valid X Value To move the trace cursor beyond the top or bottom... the X value; Moving the Trace Cursor from Function to change appropriately. that is, Y=Yn(X). The cursor follows the order of the screen. The value must TI-83 Plus Function Graphing 135
... entered are displayed in the bottom-left corner of the selected functions in the Y= editor. When the trace cursor moves along a function, the Y value is calculated from function to function, press † and }. The trace cursor moves to Any Valid X Value To move the trace cursor beyond the top or bottom... the X value; Moving the Trace Cursor from Function to change appropriately. that is, Y=Yn(X). The cursor follows the order of the screen. The value must TI-83 Plus Function Graphing 135

User Manual
Page 150
... no value is displayed for X, press ' to analyze the current graph functions. Using the CALC (Calculate) Operations CALCULATE Menu To display the CALCULATE menu, press y ãCALCä. CALCULATE 1:value 2:zero 3:minimum 4:maximum 5:intersect 6:dy/dx 7:‰f(x)dx Calculates a function Y value for a specified value of X. TI-83 Plus Function Graphing 147 Finds a zero (x-intercept) of two functions. Finds a maximum of...
... no value is displayed for X, press ' to analyze the current graph functions. Using the CALC (Calculate) Operations CALCULATE Menu To display the CALCULATE menu, press y ãCALCä. CALCULATE 1:value 2:zero 3:minimum 4:maximum 5:intersect 6:dy/dx 7:‰f(x)dx Calculates a function Y value for a specified value of X. TI-83 Plus Function Graphing 147 Finds a zero (x-intercept) of two functions. Finds a maximum of...

User Manual
Page 151
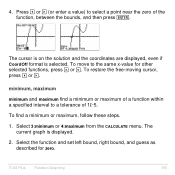
TI-83 Plus Function Graphing 148 To move the cursor from the CALCULATE menu. zero finds the zero closest to function at X, follow these steps. 1. Enter a real value, which can have more than one x-intercept value; The graph is selected. Press Í. zero zero finds a zero (x-intercept or root) of a function using solve(. To restore the free...
TI-83 Plus Function Graphing 148 To move the cursor from the CALCULATE menu. zero finds the zero closest to function at X, follow these steps. 1. Enter a real value, which can have more than one x-intercept value; The graph is selected. Press Í. zero zero finds a zero (x-intercept or root) of a function using solve(. To restore the free...

User Manual
Page 152
... Right Bound? in the bottom-left bound. The current graph is then displayed in the bottom-left corner. 2. A 4 indicator on the graph screen shows the right bound. A 3 indicator on the graph screen shows the left corner. Select 2:zero from the CALCULATE menu. Press } or † to move the cursor ...onto the function for the left and right bounds and the accuracy of your guess. Press | or ~ (or enter a value) to select the x-value for the left bound of the interval, and then press Í. TI-83 Plus Function Graphing 149...
... Right Bound? in the bottom-left bound. The current graph is then displayed in the bottom-left corner. 2. A 4 indicator on the graph screen shows the right bound. A 3 indicator on the graph screen shows the left corner. Select 2:zero from the CALCULATE menu. Press } or † to move the cursor ...onto the function for the left and right bounds and the accuracy of your guess. Press | or ~ (or enter a value) to select the x-value for the left bound of the interval, and then press Í. TI-83 Plus Function Graphing 149...
User Manual
Page 153
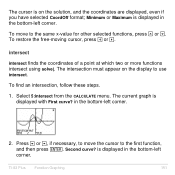
...Select 3:minimum or 4:maximum from the CALCULATE menu. Select the function and set left bound, right bound, and guess as described for other selected functions, press } or †. To move to select a point near the zero of 1âL5. The current graph is selected. To restore the free...To find a minimum or maximum of a function within a specified interval to a tolerance of the function, between the bounds, and then press Í. TI-83 Plus Function Graphing 150 4. Press | or ~ (or enter a value) to the same x-value for zero. The cursor is on the solution and the coordinates are...
...Select 3:minimum or 4:maximum from the CALCULATE menu. Select the function and set left bound, right bound, and guess as described for other selected functions, press } or †. To move to select a point near the zero of 1âL5. The current graph is selected. To restore the free...To find a minimum or maximum of a function within a specified interval to a tolerance of the function, between the bounds, and then press Í. TI-83 Plus Function Graphing 150 4. Press | or ~ (or enter a value) to the same x-value for zero. The cursor is on the solution and the coordinates are...
User Manual
Page 154
...(. TI-83 Plus Function Graphing 151 To move the cursor to the same x-value for other selected functions, press } or †. Press † or }, if necessary, to move to the first function, and then press Í. is displayed in the bottom-left corner. To find an intersection, follow these steps. 1. Select 5:intersect from the CALCULATE...
...(. TI-83 Plus Function Graphing 151 To move the cursor to the same x-value for other selected functions, press } or †. Press † or }, if necessary, to move to the first function, and then press Í. is displayed in the bottom-left corner. To find an intersection, follow these steps. 1. Select 5:intersect from the CALCULATE...

User Manual
Page 155
... second function, and then press Í. 4. To find a function's slope at which you want to calculate the derivative, and then press Í. Press ~ or | to move the cursor to location of a function at..., even if CoordOff format is displayed in the bottom-left corner. Intersection is selected. Select 6:dy/dx from the CALCULATE menu. Press } or † to select the function for which to find the numerical derivative. 3. To restore ...these steps. 1. The cursor is on the solution and the numerical derivative is displayed. 2. 3. TI-83 Plus Function Graphing 152
... second function, and then press Í. 4. To find a function's slope at which you want to calculate the derivative, and then press Í. Press ~ or | to move the cursor to location of a function at..., even if CoordOff format is displayed in the bottom-left corner. Intersection is selected. Select 6:dy/dx from the CALCULATE menu. Press } or † to select the function for which to find the numerical derivative. 3. To restore ...these steps. 1. The cursor is on the solution and the numerical derivative is displayed. 2. 3. TI-83 Plus Function Graphing 152

User Manual
Page 156
...lower and upper limits as you want to clear the shaded area. Use ClrDraw (Chapter 8) or any action that invokes Smart Graph to calculate the integral. 3. To find the numerical derivative of a function in the bottom-left and right bounds for zero. Note:...~. ‰f(x)dx ‰f(x)dx (numerical integral) finds the numerical integral of a function, follow these steps. 1. The current graph is a drawing. The integral value is displayed, and the integrated area is shaded. TI-83 Plus Function Graphing 153 in a specified interval. It uses the fnInt( function, with Lower Limit?
...lower and upper limits as you want to clear the shaded area. Use ClrDraw (Chapter 8) or any action that invokes Smart Graph to calculate the integral. 3. To find the numerical derivative of a function in the bottom-left and right bounds for zero. Note:...~. ‰f(x)dx ‰f(x)dx (numerical integral) finds the numerical integral of a function, follow these steps. 1. The current graph is a drawing. The integral value is displayed, and the integrated area is shaded. TI-83 Plus Function Graphing 153 in a specified interval. It uses the fnInt( function, with Lower Limit?

User Manual
Page 166
...if CoordOn format is on the first selected function at a time. TI-83 Plus Parametric Graphing 163 if CoordOn format is selected, X and Y are displayed. When you can move the trace cursor along the graph of the equation one Tstep at Tmin. When TRACE is displayed. ...updated; In PolarGC format, X, Y, R, and q are calculated from T. if CoordOn format is on . In RectGC format, moving cursor in Par graphing works the same as in Func graphing. TRACE To activate TRACE, press r. Exploring Parametric Graphs Free-Moving Cursor The free-moving the cursor updates the values...
...if CoordOn format is on the first selected function at a time. TI-83 Plus Parametric Graphing 163 if CoordOn format is selected, X and Y are displayed. When you can move the trace cursor along the graph of the equation one Tstep at Tmin. When TRACE is displayed. ...updated; In PolarGC format, X, Y, R, and q are calculated from T. if CoordOn format is on . In RectGC format, moving cursor in Par graphing works the same as in Func graphing. TRACE To activate TRACE, press r. Exploring Parametric Graphs Free-Moving Cursor The free-moving the cursor updates the values...
User Manual
Page 168
TI-83 Plus Parametric Graphing 165 ZOOM ZOOM operations in Par graphing work the same as in Func graphing. The CALCULATE menu items available in Func graphing. The T window variables (Tmin, Tmax, and Tstep) are 1:value, 2:dy/dx, 3:dy/dt, and 4:dx/dt. The VARS ZOOM secondary menu ZT/Zq items 1:ZTmin, 2:...
TI-83 Plus Parametric Graphing 165 ZOOM ZOOM operations in Par graphing work the same as in Func graphing. The CALCULATE menu items available in Func graphing. The T window variables (Tmin, Tmax, and Tstep) are 1:value, 2:dy/dx, 3:dy/dt, and 4:dx/dt. The VARS ZOOM secondary menu ZT/Zq items 1:ZTmin, 2:...

User Manual
Page 178
The CALCULATE menu items available in Func graphing. TI-83 Plus Polar Graphing 175 CALC CALC operations in Pol graphing work the same as in Pol graphing are 1:value, 2:dy/dx, and 3:dr/dq.
The CALCULATE menu items available in Func graphing. TI-83 Plus Polar Graphing 175 CALC CALC operations in Pol graphing work the same as in Pol graphing are 1:value, 2:dy/dx, and 3:dr/dq.


