
User Manual
Page 445
...; 1 to select 1:Finance from the CALC VARS menu. Press Œ Í to enter payment periods per year to 1. 1. TI-83 Plus Applications 442 Press Í to specify no payments when you solve compound interest problems, PMT must be set to 0 and P/Y must be set compounding periods per year. Press † 0 to select 1:TVM Solver...
...; 1 to select 1:Finance from the CALC VARS menu. Press Œ Í to enter payment periods per year to 1. 1. TI-83 Plus Applications 442 Press Í to specify no payments when you solve compound interest problems, PMT must be set to 0 and P/Y must be set compounding periods per year. Press † 0 to select 1:TVM Solver...
User Manual
Page 550
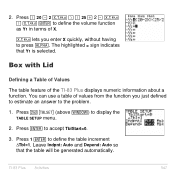
... automatically. You can use a table of values from the function you enter X quickly, without having to press ƒ. Press 1 Í to the problem. 1. Press y - (above p) to accept TblStart=0. 3. TI-83 Plus Activities 547 Box with Lid Defining a Table of Values The table feature of X. „ lets you just defined to estimate an answer to... so that Y1 is selected. Press £ 20 ¹ 2 „ ¤ £ 25 ¥ 2 to define the volume function as Y1 in terms of the TI-83 Plus displays numeric information about a function.
... automatically. You can use a table of values from the function you enter X quickly, without having to press ƒ. Press 1 Í to the problem. 1. Press y - (above p) to accept TblStart=0. 3. TI-83 Plus Activities 547 Box with Lid Defining a Table of Values The table feature of X. „ lets you just defined to estimate an answer to... so that Y1 is selected. Press £ 20 ¹ 2 „ ¤ £ 25 ¥ 2 to define the volume function as Y1 in terms of the TI-83 Plus displays numeric information about a function.

User Manual
Page 551
Notice that the maximum length of X for this problem occurs where the sign of X displayed in the table is 6.) TI-83 Plus Activities 548 Press y -. Notice that the maximum value for Y1 is about 4, between 10 and 11. 6. 4. Press y 0 (above s) to reflect the first line of the ...
Notice that the maximum length of X for this problem occurs where the sign of X displayed in the table is 6.) TI-83 Plus Activities 548 Press y -. Notice that the maximum value for Y1 is about 4, between 10 and 11. 6. 4. Press y 0 (above s) to reflect the first line of the ...

User Manual
Page 563
Comparing Test Results Using Box Plots Problem An experiment found a significant difference between boys and girls pertaining to their ability to identify objects held the other 15 objects one by the left ... by one in their brains. Women Left 8 9 12 11 10 8 Correct Guesses Women Men Right Left 4 7 1 8 8 7 12 5 11 7 11 8 Men Right 12 6 12 12 7 11 TI-83 Plus Activities 560 Use box plots to see. The TI Graphics team conducted a similar test for adult men and women.
Comparing Test Results Using Box Plots Problem An experiment found a significant difference between boys and girls pertaining to their ability to identify objects held the other 15 objects one by the left ... by one in their brains. Women Left 8 9 12 11 10 8 Correct Guesses Women Men Right Left 4 7 1 8 8 7 12 5 11 7 11 8 Men Right 12 6 12 12 7 11 TI-83 Plus Activities 560 Use box plots to see. The TI Graphics team conducted a similar test for adult men and women.

User Manual
Page 567
Graphing Piecewise Functions Problem The fine for speeding on a road with a speed limit of the ticket. plus 5 for Y1 to 55 kph; Enter the Y= function to define the piecewise function. Use the TEST menu operations to describe the fine. ...plus 10 for each kph from 46 to í (dot). The fine (Y) as a function of kilometers per hour (kph) is : Y = 0 Y = 50 + 5 (X N 45) Y = 50 + 5 ä 10 + 10 (X N 55) Y = 50 + 5 ä 10 + 10 ä 10 + 20 (X N 65) 0 < X 45 45 < X 55 55 < X 65 65 < X Procedure 1. Select Func and the default settings. 2. TI-83 Plus...
Graphing Piecewise Functions Problem The fine for speeding on a road with a speed limit of the ticket. plus 5 for Y1 to 55 kph; Enter the Y= function to define the piecewise function. Use the TEST menu operations to describe the fine. ...plus 10 for each kph from 46 to í (dot). The fine (Y) as a function of kilometers per hour (kph) is : Y = 0 Y = 50 + 5 (X N 45) Y = 50 + 5 ä 10 + 10 (X N 55) Y = 50 + 5 ä 10 + 10 ä 10 + 20 (X N 65) 0 < X 45 45 < X 55 55 < X 65 65 < X Procedure 1. Select Func and the default settings. 2. TI-83 Plus...

User Manual
Page 569
Graphing Inequalities Problem Graph the inequality 0.4X3 N 3X + 5 < 0.2X + 4. Press z. Setting Dot mode changes all functions and stat plots. Turn off all graph style icons to í (dot) ... TEST menu operations to 1 if true or 0 if false. Press o. Enter the left side of X where the inequality is true and where it is false. TI-83 Plus Activities 566 Procedure 1. Enter the statement of the inequality as Y5. 3. Select Dot, Simul, and the default settings. This function evaluates to explore the values...
Graphing Inequalities Problem Graph the inequality 0.4X3 N 3X + 5 < 0.2X + 4. Press z. Setting Dot mode changes all functions and stat plots. Turn off all graph style icons to í (dot) ... TEST menu operations to 1 if true or 0 if false. Press o. Enter the left side of X where the inequality is true and where it is false. TI-83 Plus Activities 566 Procedure 1. Enter the statement of the inequality as Y5. 3. Select Dot, Simul, and the default settings. This function evaluates to explore the values...

User Manual
Page 571
Press z. Enter the functions. 2. Select the default mode settings. Press q 4 to control the decimal places displayed on the graph. Use ZOOM factors to select 4:ZDecimal. Turn off all functions and stat plots. The display shows that two solutions may exist (points where the two functions appear to intersect). Press o. Procedure 1. TI-83 Plus Activities 568 Stated another way, solve the system of Nonlinear Equations Problem Using a graph, solve the equation X3 N 2X = 2cos(X). Solving a System of two equations and two unknowns: Y = X3N2X and Y = 2cos(X).
Press z. Enter the functions. 2. Select the default mode settings. Press q 4 to control the decimal places displayed on the graph. Use ZOOM factors to select 4:ZDecimal. Turn off all functions and stat plots. The display shows that two solutions may exist (points where the two functions appear to intersect). Press o. Procedure 1. TI-83 Plus Activities 568 Stated another way, solve the system of Nonlinear Equations Problem Using a graph, solve the equation X3 N 2X = 2cos(X). Solving a System of two equations and two unknowns: Y = X3N2X and Y = 2cos(X).

User Manual
Page 575
...z. Select Seq and the default mode settings. Procedure 1. Press o. nMin=0 Xmin=0 Ymin=M.26 nMax=10 Xmax=1 Ymax=1.1 PlotStart=1 Xscl=1 Yscl=1 PlotStep=1 TI-83 Plus Activities 572 Clear all functions and turn off all stat plots. u(n)=Ku(nN1)(1Nu(nN1)) u(nMin)=.01 3. Press y 5 to return to the home ... expression Y = K X(1NX). Set the window variables. Press y .. Select Web format and the default format settings. 2. Graphing Cobweb Attractors Problem Using Web format, you can identify points with attracting and repelling behavior in sequence graphing. Press p.
...z. Select Seq and the default mode settings. Procedure 1. Press o. nMin=0 Xmin=0 Ymin=M.26 nMax=10 Xmax=1 Ymax=1.1 PlotStart=1 Xscl=1 Yscl=1 PlotStep=1 TI-83 Plus Activities 572 Clear all functions and turn off all stat plots. u(n)=Ku(nN1)(1Nu(nN1)) u(nMin)=.01 3. Press y 5 to return to the home ... expression Y = K X(1NX). Set the window variables. Press y .. Select Web format and the default format settings. 2. Graphing Cobweb Attractors Problem Using Web format, you can identify points with attracting and repelling behavior in sequence graphing. Press p.

User Manual
Page 579
... o. Enter the expressions to show the relationship between them. Graphing the Unit Circle and Trigonometric Curves Problem Using parametric graphing mode, graph the unit circle and the sine curve to define the unit circle centered on (0,0). TI-83 Plus Activities 576 Press z. Tmin=0 Xmin=L2 Ymin=L3 Tmax=2p Xmax=7.4 Ymax=3 Tstep=.1 Xscl=pà...
... o. Enter the expressions to show the relationship between them. Graphing the Unit Circle and Trigonometric Curves Problem Using parametric graphing mode, graph the unit circle and the sine curve to define the unit circle centered on (0,0). TI-83 Plus Activities 576 Press z. Tmin=0 Xmin=L2 Ymin=L3 Tmax=2p Xmax=7.4 Ymax=3 Tstep=.1 Xscl=pà...

User Manual
Page 581
Press z. Select the default mode settings. 2. Press o. Enter the upper and lower functions. Y1=300Xà(X2+625) Y2=3cos(.1X) TI-83 Plus Activities 578 Press p. Xmin=0 Ymin=L5 Xmax=100 Ymax=10 Xscl=10 Yscl=1 Xres=1 3. Set the viewing window. Turn off all functions and stat plots. Finding the Area between Curves Problem Find the area of the region bounded by f(x) = 300x / (x2 + 625) g(x) = 3cos(.1x) x = 75 Procedure 1.
Press z. Select the default mode settings. 2. Press o. Enter the upper and lower functions. Y1=300Xà(X2+625) Y2=3cos(.1X) TI-83 Plus Activities 578 Press p. Xmin=0 Ymin=L5 Xmax=100 Ymax=10 Xscl=10 Yscl=1 Xres=1 3. Set the viewing window. Turn off all functions and stat plots. Finding the Area between Curves Problem Find the area of the region bounded by f(x) = 300x / (x2 + 625) g(x) = 3cos(.1x) x = 75 Procedure 1.

User Manual
Page 583
... ball to each other in motion are closest to the ferris wheel passenger. X(T) = b N Tv0 cosq Y(T) = Tv0 sinq N (gà2) T2 where g = 9.8 m/sec2 TI-83 Plus Activities 580 A ferris wheel has a diameter (d) of 20 meters and is the passenger's location at the rightmost point, when T=0. The parametric equations below describe the... location of the ball at a rate (s) of one revolution every 12 seconds. Using Parametric Equations: Ferris Wheel Problem Problem Using two pairs of parametric equations, determine when two objects in the same plane.
... ball to each other in motion are closest to the ferris wheel passenger. X(T) = b N Tv0 cosq Y(T) = Tv0 sinq N (gà2) T2 where g = 9.8 m/sec2 TI-83 Plus Activities 580 A ferris wheel has a diameter (d) of 20 meters and is the passenger's location at the rightmost point, when T=0. The parametric equations below describe the... location of the ball at a rate (s) of one revolution every 12 seconds. Using Parametric Equations: Ferris Wheel Problem Problem Using two pairs of parametric equations, determine when two objects in the same plane.

User Manual
Page 587
Select the default settings. 2. Xmin=.01 Ymin=M1.5 Xres=3 Xmax=10 Ymax=2.5 Xscl=1 Yscl=1 TI-83 Plus Activities 584 Press z. Press p. Demonstrating the Fundamental Theorem of Calculus Problem 1 Using the functions fnInt( and nDeriv( from the MATH menu to graph functions defined by integrals and derivatives demonstrates graphically that: x F (x) = ∫ dt = ln (x), x > 0 and that 1 ∫ Dx x 1 1 t dt = 1 x Procedure 1 1. Set the viewing window.
Select the default settings. 2. Xmin=.01 Ymin=M1.5 Xres=3 Xmax=10 Ymax=2.5 Xscl=1 Yscl=1 TI-83 Plus Activities 584 Press z. Press p. Demonstrating the Fundamental Theorem of Calculus Problem 1 Using the functions fnInt( and nDeriv( from the MATH menu to graph functions defined by integrals and derivatives demonstrates graphically that: x F (x) = ∫ dt = ln (x), x > 0 and that 1 ∫ Dx x 1 1 t dt = 1 x Procedure 1 1. Set the viewing window.
User Manual
Page 589
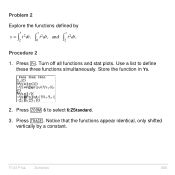
Turn off all functions and stat plots. Press r. Store the function in Y5. 2. Press q 6 to define these three functions simultaneously. TI-83 Plus Activities 586 Use a list to select 6:ZStandard. 3. Notice that the functions appear identical, only shifted vertically by x x x ∫ ∫ ∫ y = t2dt, t2dt, and t2dt, 2 0 2 Procedure 2 1. Problem 2 Explore the functions defined by a constant. Press o.
Turn off all functions and stat plots. Press r. Store the function in Y5. 2. Press q 6 to define these three functions simultaneously. TI-83 Plus Activities 586 Use a list to select 6:ZStandard. 3. Notice that the functions appear identical, only shifted vertically by x x x ∫ ∫ ∫ y = t2dt, t2dt, and t2dt, 2 0 2 Procedure 2 1. Problem 2 Explore the functions defined by a constant. Press o.

User Manual
Page 591
If the TI-83 Plus Activities 588 Press 0 to a vertex. Computing Areas of Regular N-Sided Polygons Problem Use the equation solver to store a formula for each variable, given the other variables. N = 4 sides N = 8 sides N = 12 sides Procedure 1. Consider the formula A = NB2 sin(pàN) ...
If the TI-83 Plus Activities 588 Press 0 to a vertex. Computing Areas of Regular N-Sided Polygons Problem Use the equation solver to store a formula for each variable, given the other variables. N = 4 sides N = 8 sides N = 12 sides Procedure 1. Consider the formula A = NB2 sin(pàN) ...

User Manual
Page 595
... from now. Computing and Graphing Mortgage Payments Problem You are a loan officer at 8 percent interest with monthly payments of 800. The new home owners want to know how much will be displayed as a cash inflow. Press Œ Í Í to 2 decimal places. Enter 0 for FV, TI-83 Plus Activities 592 Press z and set the...
... from now. Computing and Graphing Mortgage Payments Problem You are a loan officer at 8 percent interest with monthly payments of 800. The new home owners want to know how much will be displayed as a cash inflow. Press Œ Í Í to 2 decimal places. Enter 0 for FV, TI-83 Plus Activities 592 Press z and set the...

User Manual
Page 631
...: • When there is insufficient space to archive a variable within a continuous block and within a continuous block of memory available for storing a variable and an application. TI-83 Plus Memory and Variable Management 628 An ERR:ARCHIVE FULL message may still get an ERR: ARCHIVE FULL message. When the message is displayed, it will... MEMORY screen shows enough free space to archive a variable or store an application, you must delete variables or applications to increase space. To resolve the problem, use the GarbageCollect command to optimize memory.
...: • When there is insufficient space to archive a variable within a continuous block and within a continuous block of memory available for storing a variable and an application. TI-83 Plus Memory and Variable Management 628 An ERR:ARCHIVE FULL message may still get an ERR: ARCHIVE FULL message. When the message is displayed, it will... MEMORY screen shows enough free space to archive a variable or store an application, you must delete variables or applications to increase space. To resolve the problem, use the GarbageCollect command to optimize memory.

User Manual
Page 752
... a memory backup, the receiving unit's available memory is insufficient to transmit an item because the receiving unit's available memory is insufficient. TI-83 Plus General Information 749 You must delete to do the memory backup. Branching out of bytes the sending unit must delete items from memory (... mode or to perform the instruction or function. for example, graphing the equation Y1=Y1. Delete items and try again. Recursive problems return this error because the End statement that terminates the loop is never reached. • You are unable to receive all items...
... a memory backup, the receiving unit's available memory is insufficient to transmit an item because the receiving unit's available memory is insufficient. TI-83 Plus General Information 749 You must delete to do the memory backup. Branching out of bytes the sending unit must delete items from memory (... mode or to perform the instruction or function. for example, graphing the equation Y1=Y1. Delete items and try again. Recursive problems return this error because the End statement that terminates the loop is never reached. • You are unable to receive all items...

User Manual
Page 756
You may have attempted to zoom in or zoom out to graph correctly. TI-83 Plus General Information 753 Error Type WINDOW RANGE ZOOM Possible Causes and Suggested Remedies A problem exists with the window variables. • You defined Xmax Xmin or Ymax Ymin. • You defined qmax qmin and qstep ... Tmax Tmin and Tstep > 0 (or vice versa). • Window variables are too small or too large to a point that exceeds the TI-83 Plus's numerical range. • A point or a line, instead of a box, is defined in ZBox. • A ZOOM operation returned a math error.
You may have attempted to zoom in or zoom out to graph correctly. TI-83 Plus General Information 753 Error Type WINDOW RANGE ZOOM Possible Causes and Suggested Remedies A problem exists with the window variables. • You defined Xmax Xmin or Ymax Ymin. • You defined qmax qmin and qstep ... Tmax Tmin and Tstep > 0 (or vice versa). • Window variables are too small or too large to a point that exceeds the TI-83 Plus's numerical range. • A point or a line, instead of a box, is defined in ZBox. • A ZOOM operation returned a math error.

User Manual
Page 774
..., 662 ExprOff (expression off), 128, 662 ExprOn (expression on), 128, 662 -F- inequalities, 566 mortgage payments, 592 parametric equations, ferris wheel problem, 580 piecewise functions, 564 quadratic formula converting to a fraction, 542 displaying complex results, 544 entering a calculation, 540 Sierpinski triangle, 570 solving ...166 roots of a function, 203 sending variables, 629 solving a system of linear equations, 256 unit circle, 246 TI-83 Plus Index volume of curves, 131 Fill(, 276, 663 FINANCE CALC menu, 446 FINANCE VARS menu, 462 financial functions amortization schedules, 454 771...
..., 662 ExprOff (expression off), 128, 662 ExprOn (expression on), 128, 662 -F- inequalities, 566 mortgage payments, 592 parametric equations, ferris wheel problem, 580 piecewise functions, 564 quadratic formula converting to a fraction, 542 displaying complex results, 544 entering a calculation, 540 Sierpinski triangle, 570 solving ...166 roots of a function, 203 sending variables, 629 solving a system of linear equations, 256 unit circle, 246 TI-83 Plus Index volume of curves, 131 Fill(, 276, 663 FINANCE CALC menu, 446 FINANCE VARS menu, 462 financial functions amortization schedules, 454 771...

User Manual
Page 822
... Maximum 557 Comparing Test Results Using Box Plots 560 Problem 560 Procedure 561 Graphing Piecewise Functions 564 Problem 564 Procedure 564 Graphing Inequalities 566 Problem 566 Procedure 566 Solving a System of Nonlinear Equations 568 Problem 568 Procedure 568 Using a Program to Create the ... 570 Setting up the Program 570 Program 570 Graphing Cobweb Attractors 572 Problem 572 Procedure 572 Using a Program to Guess the Coefficients 574 Setting Up the Program 574 Program 574 Graphing the Unit Circle and Trigonometric Curves 576 TI-83 Plus Quick-Find Locator xxxi
... Maximum 557 Comparing Test Results Using Box Plots 560 Problem 560 Procedure 561 Graphing Piecewise Functions 564 Problem 564 Procedure 564 Graphing Inequalities 566 Problem 566 Procedure 566 Solving a System of Nonlinear Equations 568 Problem 568 Procedure 568 Using a Program to Create the ... 570 Setting up the Program 570 Program 570 Graphing Cobweb Attractors 572 Problem 572 Procedure 572 Using a Program to Guess the Coefficients 574 Setting Up the Program 574 Program 574 Graphing the Unit Circle and Trigonometric Curves 576 TI-83 Plus Quick-Find Locator xxxi


