User Manual
Page 2
... of merchantability and fitness for a particular purpose, regarding any other party. TI-83 Plus Macintosh is a registered trademark of Apple Computer, Inc. Windows is a registered trademark of Microsoft Corporation. Important Texas Instruments makes no event shall Texas Instruments be liable for any claim of any kind whatsoever against the use of ...connection with or arising out of the purchase or use of these materials, and the sole and exclusive liability of Texas Instruments, regardless of the form of action, shall not exceed the purchase price of this equipment.
... of merchantability and fitness for a particular purpose, regarding any other party. TI-83 Plus Macintosh is a registered trademark of Apple Computer, Inc. Windows is a registered trademark of Microsoft Corporation. Important Texas Instruments makes no event shall Texas Instruments be liable for any claim of any kind whatsoever against the use of ...connection with or arising out of the purchase or use of these materials, and the sole and exclusive liability of Texas Instruments, regardless of the form of action, shall not exceed the purchase price of this equipment.
User Manual
Page 13
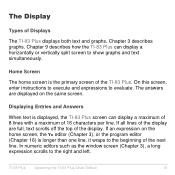
... window screen (Chapter 3), a long expression scrolls to evaluate. On this screen, enter instructions to execute and expressions to the right and left. Chapter 3 describes graphs. Home Screen The home screen is longer than one line, it wraps to show graphs and text simultaneously. TI-83 Plus Operating the TI-83 Plus Silver Edition 10 Chapter 9 describes how the TI-83 Plus...
... window screen (Chapter 3), a long expression scrolls to evaluate. On this screen, enter instructions to execute and expressions to the right and left. Chapter 3 describes graphs. Home Screen The home screen is longer than one line, it wraps to show graphs and text simultaneously. TI-83 Plus Operating the TI-83 Plus Silver Edition 10 Chapter 9 describes how the TI-83 Plus...

User Manual
Page 47
... Graph database variables Picture variables XY, G, EQ, TEST, and PTS variables TABLE variables String variables TI-83 Plus Operating the TI-83 Plus Silver Edition 44 All VARS menu items display secondary menus, which show the names of functions and system variables in... an expression or store to them directly. To display the VARS menu, press . VARS and VARS Y.VARS Menus VARS Menu You can enter the names of the system variables. 1:Window...
... Graph database variables Picture variables XY, G, EQ, TEST, and PTS variables TABLE variables String variables TI-83 Plus Operating the TI-83 Plus Silver Edition 44 All VARS menu items display secondary menus, which show the names of functions and system variables in... an expression or store to them directly. To display the VARS menu, press . VARS and VARS Y.VARS Menus VARS Menu You can enter the names of the system variables. 1:Window...

User Manual
Page 49
3. It is pasted to display other secondary menus. 4. TI-83 Plus Operating the TI-83 Plus Silver Edition 46 Select a variable name from the VARS menu, you selected 1:Window, 2:Zoom, or 5:Statistics from the menu. If you can press ~ or | to the cursor location.
3. It is pasted to display other secondary menus. 4. TI-83 Plus Operating the TI-83 Plus Silver Edition 46 Select a variable name from the VARS menu, you selected 1:Window, 2:Zoom, or 5:Statistics from the menu. If you can press ~ or | to the cursor location.

User Manual
Page 74
fnInt( fnInt( (function integral) returns the numerical integral (Gauss-Kronrod method) of the Xres window variable before you press s. fnInt( is 1âL5). TI-83 Plus Math, Angle, and Test Operations 71 fnInt(expression,variable,lower,upper[,tolerance]) Tip: To speed the drawing of integration graphs (when fnInt( is used in a Y= equation), increase the value of expression with respect to variable, given lower limit, upper limit, and a tolerance (if not specified, the default is valid only for real numbers.
fnInt( fnInt( (function integral) returns the numerical integral (Gauss-Kronrod method) of the Xres window variable before you press s. fnInt( is 1âL5). TI-83 Plus Math, Angle, and Test Operations 71 fnInt(expression,variable,lower,upper[,tolerance]) Tip: To speed the drawing of integration graphs (when fnInt( is used in a Y= equation), increase the value of expression with respect to variable, given lower limit, upper limit, and a tolerance (if not specified, the default is valid only for real numbers.

User Manual
Page 108
...adjust the display and make the functions appear as a circle. 1. The FUNCTION secondary menu is a fast-paced introduction. TI-83 Plus Function Graphing 105 Then use ZSquare (zoom square) to select 1:Function. On the TI-83 Plus, you must enter separate formulas for details. Press 1 to display the Y= editor. In Func mode, press o to .... To graph this circle, you can define one function in terms of radius 10, centered on the origin in the standard viewing window. The expression Y=L‡(100NX2) defines the bottom half of the circle. Graph a circle of another.
...adjust the display and make the functions appear as a circle. 1. The FUNCTION secondary menu is a fast-paced introduction. TI-83 Plus Function Graphing 105 Then use ZSquare (zoom square) to select 1:Function. On the TI-83 Plus, you must enter separate formulas for details. Press 1 to display the Y= editor. In Func mode, press o to .... To graph this circle, you can define one function in terms of radius 10, centered on the origin in the standard viewing window. The expression Y=L‡(100NX2) defines the bottom half of the circle. Graph a circle of another.

User Manual
Page 109
This is a quick way to reset the window variables to press s. TI-83 Plus Function Graphing 106 It also graphs the functions; you do not need to the standard values. To see the ZSquare window variables, press p and notice the new values for Xmin, Xmax, Ymin, and Ymax. Press q 6 to select 5:ZSquare. The functions are replotted and now appear as an ellipse in the standard viewing window. 3. To adjust the display so that the functions appear as a circle on the display. 4. 2. Notice that each pixel represents an equal width and height, press q 5 to select 6:ZStandard.
This is a quick way to reset the window variables to press s. TI-83 Plus Function Graphing 106 It also graphs the functions; you do not need to the standard values. To see the ZSquare window variables, press p and notice the new values for Xmin, Xmax, Ymin, and Ymax. Press q 6 to select 5:ZSquare. The functions are replotted and now appear as an ellipse in the standard viewing window. 3. To adjust the display so that the functions appear as a circle on the display. 4. 2. Notice that each pixel represents an equal width and height, press q 5 to select 6:ZStandard.

User Manual
Page 110
...steps shown here are similar for each TI-83 Plus graphing mode. Chapters 4, 5, and 6 describe aspects that are not always necessary. 1. Press z and set the appropriate graph mode. 2. and select the graph format settings. Press o and enter, edit, or select one or more functions in... any graphing mode, follow these steps. Press y . Defining a Graph To define a graph in the Y= editor. 3. TI-83 Plus Function Graphing 107 Deselect stat plots, if necessary. 4. Press p and define the viewing window variables. 6. Some steps...
...steps shown here are similar for each TI-83 Plus graphing mode. Chapters 4, 5, and 6 describe aspects that are not always necessary. 1. Press z and set the appropriate graph mode. 2. and select the graph format settings. Press o and enter, edit, or select one or more functions in... any graphing mode, follow these steps. Press y . Defining a Graph To define a graph in the Y= editor. 3. TI-83 Plus Function Graphing 107 Deselect stat plots, if necessary. 4. Press p and define the viewing window variables. 6. Some steps...

User Manual
Page 111
... database to display it. Then you stored the original graph. Explore the behavior of the function or functions using the TI-83 Plus tools described in a GDB. • Y= functions • Graph style settings • Window settings • Format settings You can store a picture of the current graph display to any of 10 graph picture...; Chapter 8). Displaying and Exploring a Graph After you have defined a graph, press s to which you can superimpose one or more stored pictures onto the current graph. TI-83 Plus Function Graphing 108 Chapter 8).
... database to display it. Then you stored the original graph. Explore the behavior of the function or functions using the TI-83 Plus tools described in a GDB. • Y= functions • Graph style settings • Window settings • Format settings You can store a picture of the current graph display to any of 10 graph picture...; Chapter 8). Displaying and Exploring a Graph After you have defined a graph, press s to which you can superimpose one or more stored pictures onto the current graph. TI-83 Plus Function Graphing 108 Chapter 8).

User Manual
Page 112
... (sequence graphing; The default settings are highlighted below. To graph functions, you must select Func mode before you enter values for the window variables and before you enter the functions. TI-83 Plus Function Graphing 109 Setting the Graph Modes Checking and Changing the Graphing Mode To display the mode screen, press z. Chapter 6) Other...
... (sequence graphing; The default settings are highlighted below. To graph functions, you must select Func mode before you enter values for the window variables and before you enter the functions. TI-83 Plus Function Graphing 109 Setting the Graph Modes Checking and Changing the Graphing Mode To display the mode screen, press z. Chapter 6) Other...

User Manual
Page 124
... portion of the coordinate plane defined by Xmin, Xmax, Ymin, and Ymax. TI-83 Plus Function Graphing 121 Xmin Ymin Ymax Xscl Xmax Yscl Displaying the Window Variables To display the current window variable values, press p. Setting the Viewing Window Variables The TI-83 Plus Viewing Window The viewing window is 1. • At Xres=1, functions are evaluated and graphed at each...
... portion of the coordinate plane defined by Xmin, Xmax, Ymin, and Ymax. TI-83 Plus Function Graphing 121 Xmin Ymin Ymax Xscl Xmax Yscl Displaying the Window Variables To display the current window variable values, press p. Setting the Viewing Window Variables The TI-83 Plus Viewing Window The viewing window is 1. • At Xres=1, functions are evaluated and graphed at each...

User Manual
Page 125
Changing a Window Variable Value To change . 2. Tip: Small Xres values improve graph resolution but may cause the TI-83 Plus to a specific digit, and then edit it . Edit the value, which can be an expression. • Enter a new value, which clears the original value. &#...8226; Move the cursor to draw graphs more slowly. The new value is stored. If you want to the window variable you entered an expression, the TI-83 Plus...
Changing a Window Variable Value To change . 2. Tip: Small Xres values improve graph resolution but may cause the TI-83 Plus to a specific digit, and then edit it . Edit the value, which can be an expression. • Enter a new value, which clears the original value. &#...8226; Move the cursor to draw graphs more slowly. The new value is stored. If you want to the window variable you entered an expression, the TI-83 Plus...

User Manual
Page 126
...144; to complete the instruction. Press Í to display the VARS menu. 4. Select 1:Window to display the Func window variables (X/Y secondary menu). • Press ~ to display the Par and Pol window variables (T/q secondary menu). • Press ~ ~ to the current cursor location. 6. Press...name of the variable is pasted to display the Seq window variables (U/V/W secondary menu). 5. Enter the value you want to a window variable, begin on a blank line and follow these steps. 1. TI-83 Plus Function Graphing 123 Select the window variable to which can be an expression, to store....
...144; to complete the instruction. Press Í to display the VARS menu. 4. Select 1:Window to display the Func window variables (X/Y secondary menu). • Press ~ to display the Par and Pol window variables (T/q secondary menu). • Press ~ ~ to the current cursor location. 6. Press...name of the variable is pasted to display the Seq window variables (U/V/W secondary menu). 5. Enter the value you want to a window variable, begin on a blank line and follow these steps. 1. TI-83 Plus Function Graphing 123 Select the window variable to which can be an expression, to store....

User Manual
Page 127
When the instruction is executed, the TI-83 Plus stores the value to the window variable and displays the value. @X and @Y The variables @X and @Y (items 8 and 9 on the VARS (1:Window) X/Y secondary menu) define the distance from the center of one pixel to @X and @Y. TI-83 Plus Function Graphing 124 If you display a graph. (Xmax N Xmin) @X = 94 (Ymax N Ymin) @Y = 62...
When the instruction is executed, the TI-83 Plus stores the value to the window variable and displays the value. @X and @Y The variables @X and @Y (items 8 and 9 on the VARS (1:Window) X/Y secondary menu) define the distance from the center of one pixel to @X and @Y. TI-83 Plus Function Graphing 124 If you display a graph. (Xmax N Xmin) @X = 94 (Ymax N Ymin) @Y = 62...

User Manual
Page 130
AxesOff does not display the axes. LabelOff, LabelOn LabelOff and LabelOn determine whether to the tick marks on each axis. TI-83 Plus Function Graphing 127 GridOn displays grid points. This overrides the LabelOff/LabelOn format setting. AxesOn, AxesOff AxesOn displays the axes. GridOff does not display grid points. GridOff, GridOn Grid points cover the viewing window in rows that correspond to display labels for the axes (X and Y), if AxesOn format is also selected.
AxesOff does not display the axes. LabelOff, LabelOn LabelOff and LabelOn determine whether to the tick marks on each axis. TI-83 Plus Function Graphing 127 GridOn displays grid points. This overrides the LabelOff/LabelOn format setting. AxesOn, AxesOff AxesOn displays the axes. GridOff does not display grid points. GridOff, GridOn Grid points cover the viewing window in rows that correspond to display labels for the axes (X and Y), if AxesOn format is also selected.
User Manual
Page 133
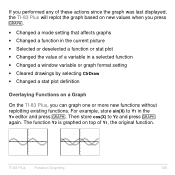
...a selected function • Changed a window variable or graph format setting • Cleared drawings by selecting ClrDraw • Changed a stat plot definition Overlaying Functions on top of Y1, the original function. TI-83 Plus Function Graphing 130 The function Y2 is graphed on a Graph On the TI-83 Plus, you press s. • Changed ...sin(X) to Y2 and press s again. If you performed any of these actions since the graph was last displayed, the TI-83 Plus will replot the graph based on new values when you can graph one or more new functions without replotting existing functions.
...a selected function • Changed a window variable or graph format setting • Cleared drawings by selecting ClrDraw • Changed a stat plot definition Overlaying Functions on top of Y1, the original function. TI-83 Plus Function Graphing 130 The function Y2 is graphed on a Graph On the TI-83 Plus, you press s. • Changed ...sin(X) to Y2 and press s again. If you performed any of these actions since the graph was last displayed, the TI-83 Plus will replot the graph based on new values when you can graph one or more new functions without replotting existing functions.

User Manual
Page 135
When you move the cursor to a pixel that appears to pixel on , the function. The coordinate TI-83 Plus Function Graphing 132 When you press |, ~, }, or †, the cursor moves from the center of the viewing window. When you press |, ~, }, or †, the cursor moves from pixel to be on the function, the cursor may...
When you move the cursor to a pixel that appears to pixel on , the function. The coordinate TI-83 Plus Function Graphing 132 When you press |, ~, }, or †, the cursor moves from the center of the viewing window. When you press |, ~, }, or †, the cursor moves from pixel to be on the function, the cursor may...

User Manual
Page 139
...feature does not apply to the new viewing window. When you trace a function beyond the left or right. This allows panning up and down. TI-83 Plus Function Graphing 136 Quick Zoom While tracing, you can press Í to adjust the viewing window so that the cursor location becomes the center... of the screen, the viewing window automatically pans to move the cursor. Xmin and Xmax...
...feature does not apply to the new viewing window. When you trace a function beyond the left or right. This allows panning up and down. TI-83 Plus Function Graphing 136 Quick Zoom While tracing, you can press Í to adjust the viewing window so that the cursor location becomes the center... of the screen, the viewing window automatically pans to move the cursor. Xmin and Xmax...

User Manual
Page 141
... YMin and YMax between XMin and XMax. Sets integer values on the X and Y axes. Sets @X and @Y to define the viewing window. Views more of the graph quickly in trig window variables. TI-83 Plus Function Graphing 138 Sets equal-size pixels on the X and Y axes. Exploring Graphs with the ZOOM Instructions ZOOM Menu To display...
... YMin and YMax between XMin and XMax. Sets integer values on the X and Y axes. Sets @X and @Y to define the viewing window. Views more of the graph quickly in trig window variables. TI-83 Plus Function Graphing 138 Sets equal-size pixels on the X and Y axes. Exploring Graphs with the ZOOM Instructions ZOOM Menu To display...

User Manual
Page 142
... you move the cursor, the sides of the box lengthen or shorten proportionately on the graph becomes the zoom cursor (+), a smaller version of the screen. 2. TI-83 Plus Function Graphing 139 The zoom cursor is displayed at the center of the free-moving cursor (+). As you move the cursor away from the ZOOM... you press Í, press '. 4. Zoom Cursor When you select 1:ZBox, 2:Zoom In, or 3:Zoom Out, the cursor on the screen. ZBox To define a new viewing window using ZBox, follow these steps. 1.
... you move the cursor, the sides of the box lengthen or shorten proportionately on the graph becomes the zoom cursor (+), a smaller version of the screen. 2. TI-83 Plus Function Graphing 139 The zoom cursor is displayed at the center of the free-moving cursor (+). As you move the cursor away from the ZOOM... you press Í, press '. 4. Zoom Cursor When you select 1:ZBox, 2:Zoom In, or 3:Zoom Out, the cursor on the screen. ZBox To define a new viewing window using ZBox, follow these steps. 1.


