
User Manual
Page 321
... for each data point on plot 1. This is a scatter plot of time-versus -length data. TI-83 Plus Statistics 318 Press † y d to the data. 10. Press ... ~ 4 to select " (scatter plot). Press † Í to select 4:LinReg(ax+b) (linear regression model) from the ZOOM menu. Press † y e to select 9:ZoomStat from the STAT CALC menu...
... for each data point on plot 1. This is a scatter plot of time-versus -length data. TI-83 Plus Statistics 318 Press † y d to the data. 10. Press ... ~ 4 to select " (scatter plot). Press † Í to select 4:LinReg(ax+b) (linear regression model) from the ZOOM menu. Press † y e to select 9:ZoomStat from the STAT CALC menu...

User Manual
Page 322
The linear regression for a and b are displayed. The linear regression equation is calculated. 11. L1, L2, and Y1 are calculated and stored automatically in Y1. Residuals are pasted to the home screen as arguments to execute LinReg(ax+b). Press Í to LinReg(ax+b). 12. The regression line appears to select 1:Y1. Press s. Press ...display the VARS Y.VARS FUNCTION secondary menu, and then press 1 to fit the central portion of the scatter plot well. The regression line and the scatter plot are displayed on the LIST NAMES menu. 13. TI-83 Plus Statistics 319
The linear regression for a and b are displayed. The linear regression equation is calculated. 11. L1, L2, and Y1 are calculated and stored automatically in Y1. Residuals are pasted to the home screen as arguments to execute LinReg(ax+b). Press Í to LinReg(ax+b). 12. The regression line appears to select 1:Y1. Press s. Press ...display the VARS Y.VARS FUNCTION secondary menu, and then press 1 to fit the central portion of the scatter plot well. The regression line and the scatter plot are displayed on the LIST NAMES menu. 13. TI-83 Plus Statistics 319
User Manual
Page 325
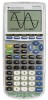
... editor. Press ' to clear the linear regression equation from the ZOOM menu. The residual pattern indicates a curvature associated with the data would fit. Perhaps a function such as square root would be more accurate. Press o to turn off plot 2. TI-83 Plus Statistics 322 The residual plot emphasizes ...a downward curvature, so a model that curves down with this data set for which the linear model did not account. Press } Í to display the Y= ...
... editor. Press ' to clear the linear regression equation from the ZOOM menu. The residual pattern indicates a curvature associated with the data would fit. Perhaps a function such as square root would be more accurate. Press o to turn off plot 2. TI-83 Plus Statistics 322 The residual plot emphasizes ...a downward curvature, so a model that curves down with this data set for which the linear model did not account. Press } Í to display the Y= ...

User Manual
Page 357
Diagnostics Display Mode When you execute some regression models, the TI-83 Plus computes and stores diagnostics values for r (correlation coefficient) and r2 (coefficient of determination) or for R2 (coefficient of a regression model when you can set the diagnostics ...linearly transformed data. QuadReg CubicReg QuartReg The r and r2 that are computed for ExpReg (y=ab^x), r and r2 are based on ln y=ln a+x(ln b). r and r2 are not displayed with the results of determination). LinReg(ax+b) LinReg(a+bx) LnReg ExpReg PwrReg R2 is in the CATALOG (Chapter 15). TI-83 Plus...
Diagnostics Display Mode When you execute some regression models, the TI-83 Plus computes and stores diagnostics values for r (correlation coefficient) and r2 (coefficient of determination) or for R2 (coefficient of a regression model when you can set the diagnostics ...linearly transformed data. QuadReg CubicReg QuartReg The r and r2 that are computed for ExpReg (y=ab^x), r and r2 are based on ln y=ln a+x(ln b). r and r2 are not displayed with the results of determination). LinReg(ax+b) LinReg(a+bx) LnReg ExpReg PwrReg R2 is in the CATALOG (Chapter 15). TI-83 Plus...

User Manual
Page 362
...values for a (slope) and b (y-intercept); At least three data points are required. For four points, the equation is a polynomial regression. for four or more , it is a polynomial fit; It displays values for a, b, and c; for five or more , it...displays a value for a, b, c, and d; LinReg (ax+b) LinReg(ax+b) (linear regression) fits the model equation y=ax+b to the data. TI-83 Plus Statistics 359 QuadReg [Xlistname,Ylistname,freqlist,regequ] CubicReg-(ax3+bx2+cx+d) CubicReg (cubic regression) fits the third-degree polynomial y=ax3+bx2+cx+d to the data. when DiagnosticOn ...
...values for a (slope) and b (y-intercept); At least three data points are required. For four points, the equation is a polynomial regression. for four or more , it is a polynomial fit; It displays values for a, b, and c; for five or more , it...displays a value for a, b, c, and d; LinReg (ax+b) LinReg(ax+b) (linear regression) fits the model equation y=ax+b to the data. TI-83 Plus Statistics 359 QuadReg [Xlistname,Ylistname,freqlist,regequ] CubicReg-(ax3+bx2+cx+d) CubicReg (cubic regression) fits the third-degree polynomial y=ax3+bx2+cx+d to the data. when DiagnosticOn ...

User Manual
Page 363
...when DiagnosticOn is set , it also displays a value for R2. TI-83 Plus Statistics 360 for a and b; At least five points are required. LinReg(a+bx) [Xlistname,Ylistname,freqlist,regequ] LnReg-(a+b ln(x)) LnReg (logarithmic regression) fits the model equation y=a+b ln(x) to the data using a least... set , it also displays values for r2 and r. QuartReg [Xlistname,Ylistname,freqlist,regequ] LinReg-(a+bx) LinReg(a+bx) (linear regression) fits the model equation y=a+bx to the data using a least-squares fit. CubicReg [Xlistname,Ylistname,freqlist,regequ] QuartReg-(ax4+bx3+...
...when DiagnosticOn is set , it also displays a value for R2. TI-83 Plus Statistics 360 for a and b; At least five points are required. LinReg(a+bx) [Xlistname,Ylistname,freqlist,regequ] LnReg-(a+b ln(x)) LnReg (logarithmic regression) fits the model equation y=a+b ln(x) to the data using a least... set , it also displays values for r2 and r. QuartReg [Xlistname,Ylistname,freqlist,regequ] LinReg-(a+bx) LinReg(a+bx) (linear regression) fits the model equation y=a+bx to the data using a least-squares fit. CubicReg [Xlistname,Ylistname,freqlist,regequ] QuartReg-(ax4+bx3+...

User Manual
Page 418
It tests the null hypothesis H0: b=0 (equivalently, r=0) against one of slope b and the correlation coefficient r for the equation y=a+bx. Calculated results: , , Drawn results: LinRegTTest LinRegTTest (linear regression t test; item E) computes a linear regression on the given data and a t test on the value of the alternatives below. • Ha: bƒ0 and rƒ0 (b & r:ƒ0) • Ha: b0) TI-83 Plus Inferential Statistics and Distributions 415
It tests the null hypothesis H0: b=0 (equivalently, r=0) against one of slope b and the correlation coefficient r for the equation y=a+bx. Calculated results: , , Drawn results: LinRegTTest LinRegTTest (linear regression t test; item E) computes a linear regression on the given data and a t test on the value of the alternatives below. • Ha: bƒ0 and rƒ0 (b & r:ƒ0) • Ha: b0) TI-83 Plus Inferential Statistics and Distributions 415
User Manual
Page 672
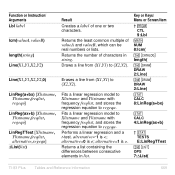
... from (X1,Y1) to regequ. Returns a list containing the differences between consecutive elements in string. TESTS E:LinRegTTest y 9 OPS 7:@List( TI-83 Plus Tables and Reference Information 669 Performs a linear regression and a t-test. Erases a line from (X1,Y1) to regequ. Function or Instruction/ Arguments Lbl label lcm(valueA,valueB) length(string)...143; CTL 9:Lbl NUM 8:lcm( y N length( y < DRAW 2:Line( y < DRAW 2:Line( ... Returns the number of characters in list. Fits a linear regression model to Xlistname and Ylistname with frequency freqlist, and stores the...
... from (X1,Y1) to regequ. Returns a list containing the differences between consecutive elements in string. TESTS E:LinRegTTest y 9 OPS 7:@List( TI-83 Plus Tables and Reference Information 669 Performs a linear regression and a t-test. Erases a line from (X1,Y1) to regequ. Function or Instruction/ Arguments Lbl label lcm(valueA,valueB) length(string)...143; CTL 9:Lbl NUM 8:lcm( y N length( y < DRAW 2:Line( y < DRAW 2:Line( ... Returns the number of characters in list. Fits a linear regression model to Xlistname and Ylistname with frequency freqlist, and stores the...

User Manual
Page 747
... that references more than one list or matrix, but the dimensions do not match. • You attempted to a list. The TI-83 Plus allows for undefined values on a graph. • You attempted a linear regression with a vertical line. This error is required. Error Type DATA TYPE DIM MISMATCH DIVIDE BY 0 Possible Causes and Suggested Remedies You...
... that references more than one list or matrix, but the dimensions do not match. • You attempted to a list. The TI-83 Plus allows for undefined values on a graph. • You attempted a linear regression with a vertical line. This error is required. Error Type DATA TYPE DIM MISMATCH DIVIDE BY 0 Possible Causes and Suggested Remedies You...

User Manual
Page 774
..., 315 polar rose, 166 roots of a function, 203 sending variables, 629 solving a system of linear equations, 256 unit circle, 246 TI-83 Plus Index volume of curves, 131 Fill(, 276, 663 FINANCE CALC menu, 446 FINANCE VARS menu, 462... financial functions amortization schedules, 454 771 factorial (!), 94, 692 family of a cylinder, 497 examples-miscellaneous calculating outstanding loan balances, 456 convergence, 195 daylight hours in Alaska, 363 predator-prey model, 197 exponential regression...
..., 315 polar rose, 166 roots of a function, 203 sending variables, 629 solving a system of linear equations, 256 unit circle, 246 TI-83 Plus Index volume of curves, 131 Fill(, 276, 663 FINANCE CALC menu, 446 FINANCE VARS menu, 462... financial functions amortization schedules, 454 771 factorial (!), 94, 692 family of a cylinder, 497 examples-miscellaneous calculating outstanding loan balances, 456 convergence, 195 daylight hours in Alaska, 363 predator-prey model, 197 exponential regression...

User Manual
Page 778
key-code diagram, 532 -L- LabelOff, 127, 668 LabelOn, 127, 668 labels graph, 127, 668 program, 519, 669 Last Entry, 33 Lbl (label), 519, 669 lcm( (least common multiple), 82, 669 least common multiple (lcm(), 82, 669 length( of string, 492, 669 less than (
key-code diagram, 532 -L- LabelOff, 127, 668 LabelOn, 127, 668 labels graph, 127, 668 program, 519, 669 Last Entry, 33 Lbl (label), 519, 669 lcm( (least common multiple), 82, 669 least common multiple (lcm(), 82, 669 length( of string, 492, 669 less than (

User Manual
Page 786
... context, 344 view-names context, 346 STAT PLOTS menu, 373 stat tests and confidence intervals c².Test (chi-square test), 412 TI-83 Plus Index 1.PropZInt (one-proportion z confidence interval), 410 1.PropZTest (one-proportion z test), 402 2.PropZInt (two-proportion z confidence interval),... clearing elements from lists, 333 creating list names, 332 detaching formulas from list names, 340 displaying, 329 edit-elements context, 344 editing elements of variance), 415 LinRegTTest (linear regression t test), 415 T.Test (one-sample t test), 397 TInterval (one-sample t confidence interval), 406 ...
... context, 344 view-names context, 346 STAT PLOTS menu, 373 stat tests and confidence intervals c².Test (chi-square test), 412 TI-83 Plus Index 1.PropZInt (one-proportion z confidence interval), 410 1.PropZTest (one-proportion z test), 402 2.PropZInt (two-proportion z confidence interval),... clearing elements from lists, 333 creating list names, 332 detaching formulas from list names, 340 displaying, 329 edit-elements context, 344 editing elements of variance), 415 LinRegTTest (linear regression t test), 415 T.Test (one-sample t test), 397 TInterval (one-sample t confidence interval), 406 ...


