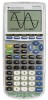
User Manual
Page 19
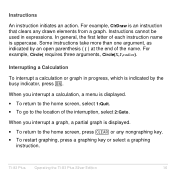
When you interrupt a graph, a partial graph is displayed. • To return to the location of the name. When you interrupt a calculation, a menu is uppercase. For example, Circle( requires three arguments, Circle(X,Y,radius). TI-83 Plus Operating the TI-83 Plus Silver Edition 16 In general, the first letter of each instruction name is displayed. • To return to the home screen, select...
When you interrupt a graph, a partial graph is displayed. • To return to the location of the name. When you interrupt a calculation, a menu is uppercase. For example, Circle( requires three arguments, Circle(X,Y,radius). TI-83 Plus Operating the TI-83 Plus Silver Edition 16 In general, the first letter of each instruction name is displayed. • To return to the home screen, select...

User Manual
Page 25
... radians. TI-83 Plus Operating the TI-83 Plus Silver Edition 22 Radian mode interprets angle values as degrees. The decimal setting applies to these numbers: • An answer displayed on the home screen • Coordinates on a graph (Chapters 3, 4, 5, and 6) • The Tangent( DRAW instruction equation of the line, x, and dy/dx values (Chapter 8) • Results of CALCULATE operations (Chapters...
... radians. TI-83 Plus Operating the TI-83 Plus Silver Edition 22 Radian mode interprets angle values as degrees. The decimal setting applies to these numbers: • An answer displayed on the home screen • Coordinates on a graph (Chapters 3, 4, 5, and 6) • The Tangent( DRAW instruction equation of the line, x, and dy/dx values (Chapter 8) • Results of CALCULATE operations (Chapters...

User Manual
Page 116
Select the function name, which pastes the name to complete the instruction. A list of X. Evaluating Y= Functions in Expressions You can calculate the value of a Y= function Yn at a specified value of values returns a list. Press Í to the cursor location on the home screen or program editor. 5. 4. "expression"!Yn When the instruction is executed, the TI-83 Plus stores the expression to the designated variable Yn, selects the function, and displays the message Done. Yn(value) Yn({value1,value2,value3, . . .,value n}) TI-83 Plus Function Graphing 113
Select the function name, which pastes the name to complete the instruction. A list of X. Evaluating Y= Functions in Expressions You can calculate the value of a Y= function Yn at a specified value of values returns a list. Press Í to the cursor location on the home screen or program editor. 5. 4. "expression"!Yn When the instruction is executed, the TI-83 Plus stores the expression to the designated variable Yn, selects the function, and displays the message Done. Yn(value) Yn({value1,value2,value3, . . .,value n}) TI-83 Plus Function Graphing 113

User Manual
Page 127
TI-83 Plus Function Graphing 124 If you do, Xmax and Ymax are calculated from @X, Xmin, @Y, and Ymin. When the instruction is executed, the TI-83 Plus stores the value to the window variable and displays the value. @X and @Y The variables @X and @Y (items 8 and 9 on the VARS (1:Window) X/Y secondary menu) define the ...
TI-83 Plus Function Graphing 124 If you do, Xmax and Ymax are calculated from @X, Xmin, @Y, and Ymin. When the instruction is executed, the TI-83 Plus stores the value to the window variable and displays the value. @X and @Y The variables @X and @Y (items 8 and 9 on the VARS (1:Window) X/Y secondary menu) define the ...

User Manual
Page 392
...graph. Select Data or Stats input Enter values for each hypothesis test and confidence interval instruction. This chapter describes the selections in the above steps for the Pooled option, if the selection is available) to test, if the selection is available. 5. 3. Select Calculate... for arguments Select an alternative hypothesis Select Calculate or Draw output TI-83 Plus Inferential Statistics and Distributions 389 Select the alternative hypothesis (ƒ, ) against which to execute the instruction. • When you select Calculate, the results are displayed on the home...
...graph. Select Data or Stats input Enter values for each hypothesis test and confidence interval instruction. This chapter describes the selections in the above steps for the Pooled option, if the selection is available) to test, if the selection is available. 5. 3. Select Calculate... for arguments Select an alternative hypothesis Select Calculate or Draw output TI-83 Plus Inferential Statistics and Distributions 389 Select the alternative hypothesis (ƒ, ) against which to execute the instruction. • When you select Calculate, the results are displayed on the home...

User Manual
Page 395
... test statistic and p-value with the graph. TI-83 Plus Inferential Statistics and Distributions 392 Selecting Calculate for a Confidence Interval After you have entered all arguments in an inferential stat editor for a confidence interval, select Calculate to see the calculated results on the home screen (Calculate) or on the graph screen (Draw). • Calculate calculates the test results and displays the...
... test statistic and p-value with the graph. TI-83 Plus Inferential Statistics and Distributions 392 Selecting Calculate for a Confidence Interval After you have entered all arguments in an inferential stat editor for a confidence interval, select Calculate to see the calculated results on the home screen (Calculate) or on the graph screen (Draw). • Calculate calculates the test results and displays the...

User Manual
Page 660
...; I/O 8:ClrHome TI-83 Plus Tables and Reference Information 657 drawflag=0 calculates results. Performs a chi-square test. Clears the home screen. Draws a circle with center (X,Y) and radius. Key or Keys/ Menu or Screen/Item y = DISTR 7:c2cdf( y = DISTR 6:c2pdf( † ... Sets to 0 the dimension of all drawn elements from a graph or drawing. Function or Instruction/ Arguments c2cdf...
...; I/O 8:ClrHome TI-83 Plus Tables and Reference Information 657 drawflag=0 calculates results. Performs a chi-square test. Clears the home screen. Draws a circle with center (X,Y) and radius. Key or Keys/ Menu or Screen/Item y = DISTR 7:c2cdf( y = DISTR 6:c2pdf( † ... Sets to 0 the dimension of all drawn elements from a graph or drawing. Function or Instruction/ Arguments c2cdf...

User Manual
Page 679
...... alternative=L1 is . TESTS 5:1-PropZTest( TI-83 Plus Tables and Reference Information 676 drawflag=1 draws results; Key or Keys/ Menu or Screen/Item † y . Function or Instruction/ Arguments PolarGC prgmname Result Sets polar graphing coordinates format. Returns product of the principal amount...proportion z confidence interval. 1.PropZTest(p0,x,n [,alternative,drawflag]) Computes a one-proportion z test. drawflag=0 calculates results. TESTS A:1-PropZInt( † ... GPrn(pmt1,pmt2 [,roundvalue]) prod(list[,start and end. Prompt variableA Prompts for value ...
...... alternative=L1 is . TESTS 5:1-PropZTest( TI-83 Plus Tables and Reference Information 676 drawflag=1 draws results; Key or Keys/ Menu or Screen/Item † y . Function or Instruction/ Arguments PolarGC prgmname Result Sets polar graphing coordinates format. Returns product of the principal amount...proportion z confidence interval. 1.PropZTest(p0,x,n [,alternative,drawflag]) Computes a one-proportion z test. drawflag=0 calculates results. TESTS A:1-PropZInt( † ... GPrn(pmt1,pmt2 [,roundvalue]) prod(list[,start and end. Prompt variableA Prompts for value ...

User Manual
Page 686
...calculates results. Selects one or more specific data points from the stat list editor, and then restores list names L1 through L6 to columns 1 through 6. Sets mode to the CBL 2/CBL or CBR System. Sets sequence graphing mode. EDIT 5:SetUpEditor TI-83 Plus ...Tables and Reference Information 683 TESTS 3:2-SampZTest( † z Sci y 9 OPS 8:Select( † I/O B:Send( y 9 OPS 5:seq( † z Seq † z Sequential ... alternative=L1 is . Function or Instruction/ Arguments 2.SampZTest(s1,s2, v1,...
...calculates results. Selects one or more specific data points from the stat list editor, and then restores list names L1 through L6 to columns 1 through 6. Sets mode to the CBL 2/CBL or CBR System. Sets sequence graphing mode. EDIT 5:SetUpEditor TI-83 Plus ...Tables and Reference Information 683 TESTS 3:2-SampZTest( † z Sci y 9 OPS 8:Select( † I/O B:Send( y 9 OPS 5:seq( † z Seq † z Sequential ... alternative=L1 is . Function or Instruction/ Arguments 2.SampZTest(s1,s2, v1,...

User Manual
Page 691
... † ... Performs a t test with frequency freqlist. alternative=0 is < ; drawflag=0 calculates results. Computes the number of each payment. Computes the amount of payment periods. Function or Instruction/ Arguments Trace T-Test m0[,listname, freqlist,alternative, drawflag] (Data list input) T-Test m0..., P/Y,C/Y)] Result Displays the graph and enters TRACE mode. TESTS 2:T-Test Œ 1:Finance CALC 6:tvm_FV Œ 1:Finance CALC 3:tvm_( Œ 1:Finance CALC 5:tvm_( Œ 1:Finance CALC 2:tvm_Pmt Œ 1:Finance CALC 4:tvm_PV TI-83 Plus Tables and Reference Information 688...
... † ... Performs a t test with frequency freqlist. alternative=0 is < ; drawflag=0 calculates results. Computes the number of each payment. Computes the amount of payment periods. Function or Instruction/ Arguments Trace T-Test m0[,listname, freqlist,alternative, drawflag] (Data list input) T-Test m0..., P/Y,C/Y)] Result Displays the graph and enters TRACE mode. TESTS 2:T-Test Œ 1:Finance CALC 6:tvm_FV Œ 1:Finance CALC 3:tvm_( Œ 1:Finance CALC 5:tvm_( Œ 1:Finance CALC 2:tvm_Pmt Œ 1:Finance CALC 4:tvm_PV TI-83 Plus Tables and Reference Information 688...

User Manual
Page 753
... TI-83 Plus allows for undefined values on a graph. You attempted to use a system variable inappropriately. The TI-83 Plus allows for undefined values on a graph. The TI-83 Plus allows for L1. • The SinReg instruction or a polynomial regression generated a singular matrix (determinant = 0) because it could not find a solution, or a solution does not exist. This error is beyond the range of a calculation...
... TI-83 Plus allows for undefined values on a graph. You attempted to use a system variable inappropriately. The TI-83 Plus allows for undefined values on a graph. The TI-83 Plus allows for L1. • The SinReg instruction or a polynomial regression generated a singular matrix (determinant = 0) because it could not find a solution, or a solution does not exist. This error is beyond the range of a calculation...

User Manual
Page 777
... calculating test results (Calculate), 392 confidence interval calculations, 392 data input or stats input, 390 entering argument values, 390 graphing test results (Draw), 392 input descriptions table, 419 pooled option, 391 STAT TESTS menu, 394 test and interval output variables, 422 Input, 526, 527, 667 insert cursor, 12 TI-83 Plus Index inString( (in string), 492, 667 instruction...
... calculating test results (Calculate), 392 confidence interval calculations, 392 data input or stats input, 390 entering argument values, 390 graphing test results (Draw), 392 input descriptions table, 419 pooled option, 391 STAT TESTS menu, 394 test and interval output variables, 422 Input, 526, 527, 667 insert cursor, 12 TI-83 Plus Index inString( (in string), 492, 667 instruction...

User Manual
Page 788
...TI.83 Plus key code diagram, 532 keyboard, 2 menu map, 698 TI Connect, 632 TI.GRAPH LINK, 632, 633 Time axes format, 187, 687 time value of money (TVM) TI-83 Plus Index æ variable (annual interest rate), 462 Ú variable (number of payment periods), 462 C/Y variable (number of compounding periods per year), 463 calculating... support, 758 Temperature, 468 Temp-Time, 468 TEST (relational menu), 101 TEST LOGIC (Boolean menu), 103 Text( instruction, 230, 254, 687 placing on a graph, 230, 254 Then, 513, 666 thick (è) graph style, 117 TI.82 link differences, 646 transmitting to/from, 644...
...TI.83 Plus key code diagram, 532 keyboard, 2 menu map, 698 TI Connect, 632 TI.GRAPH LINK, 632, 633 Time axes format, 187, 687 time value of money (TVM) TI-83 Plus Index æ variable (annual interest rate), 462 Ú variable (number of payment periods), 462 C/Y variable (number of compounding periods per year), 463 calculating... support, 758 Temperature, 468 Temp-Time, 468 TEST (relational menu), 101 TEST LOGIC (Boolean menu), 103 Text( instruction, 230, 254, 687 placing on a graph, 230, 254 Then, 513, 666 thick (è) graph style, 117 TI.82 link differences, 646 transmitting to/from, 644...

User Manual
Page 789
... off axes, 127 calculator, 6 coordinates, 126 expressions, 128 functions, 115 grid, 127 labels, 127 pixels, 237 points, 233 stat plots, 115, 375 tvm_Ú (# payment periods), 450, 688 tvm_FV (future value), 451, 688 TI-83 Plus Index tvm_I% (interest...instruction in a program, 137, 688 transmitting error conditions, 652 from a TI.73 to a TI.83 Plus, 648 from a TI.82 to a TI.83 Plus, 646 lists to a TI.73, 642 lists to a TI.82, 641 lists to a TI.83 Plus, 648 stopping, 637 to an additional TI.83 Plus, 638 transpose matrix (T), 275, 693 TRIGGER, 480 trigonometric functions, 63 turning on a graph...
... off axes, 127 calculator, 6 coordinates, 126 expressions, 128 functions, 115 grid, 127 labels, 127 pixels, 237 points, 233 stat plots, 115, 375 tvm_Ú (# payment periods), 450, 688 tvm_FV (future value), 451, 688 TI-83 Plus Index tvm_I% (interest...instruction in a program, 137, 688 transmitting error conditions, 652 from a TI.73 to a TI.83 Plus, 648 from a TI.82 to a TI.83 Plus, 646 lists to a TI.73, 642 lists to a TI.82, 641 lists to a TI.83 Plus, 648 stopping, 637 to an additional TI.83 Plus, 638 transpose matrix (T), 275, 693 TRIGGER, 480 trigonometric functions, 63 turning on a graph...

User Manual
Page 821
...524 PRGM I/O (Input/Output) Instructions 525 PRGM I/O Menu 525 Displaying a Graph with Input 526 Storing a Variable Value with Input 527 Prompt 528 Displaying the Home Screen 528 Displaying Values and Messages 529 DispGraph 530 DispTable 530 Output 530 getKey 531 TI-83 Plus Key Code Diagram 532 ClrHome,... Programs 536 Running an Assembly Language Program 537 Chapter 17: Activities 540 The Quadratic Formula 540 Entering a Calculation 540 Converting to a Fraction 542 Displaying Complex Results 544 Box with Lid 546 Defining a Function 546 TI-83 Plus Quick-Find Locator xxx
...524 PRGM I/O (Input/Output) Instructions 525 PRGM I/O Menu 525 Displaying a Graph with Input 526 Storing a Variable Value with Input 527 Prompt 528 Displaying the Home Screen 528 Displaying Values and Messages 529 DispGraph 530 DispTable 530 Output 530 getKey 531 TI-83 Plus Key Code Diagram 532 ClrHome,... Programs 536 Running an Assembly Language Program 537 Chapter 17: Activities 540 The Quadratic Formula 540 Entering a Calculation 540 Converting to a Fraction 542 Displaying Complex Results 544 Box with Lid 546 Defining a Function 546 TI-83 Plus Quick-Find Locator xxx

