
User Manual
Page 196
...; It cannot reference n directly. • It cannot reference any defined sequence except itself. TI-83 Plus Sequence Graphing 193 A web plot graphs u(n) versus u(nN1), which you can see how the sequence may change behavior as its initial value changes. You can use to study long-term behavior (convergence, divergence, or oscillation) of a recursive sequence.
...; It cannot reference n directly. • It cannot reference any defined sequence except itself. TI-83 Plus Sequence Graphing 193 A web plot graphs u(n) versus u(nN1), which you can see how the sequence may change behavior as its initial value changes. You can use to study long-term behavior (convergence, divergence, or oscillation) of a recursive sequence.
User Manual
Page 197
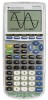
... the Web To activate the trace cursor, press r. Press ~ repeatedly to press ~. However, the sequence may or may not actually converge at the initial value u(nMin) (when PlotStart=1). 2. It repeats this course. 1. Displaying the Graph Screen In Web format, press ... to display the graph screen. It moves vertically (up or down) to the sequence. 3. TI-83 Plus Sequence Graphing 194 Note: A potential convergence point occurs whenever a sequence intersects the y=x reference line. The TI-83 Plus: • Draws a y=x reference line in AxesOn format. • Plots the selected sequences with...
... the Web To activate the trace cursor, press r. Press ~ repeatedly to press ~. However, the sequence may or may not actually converge at the initial value u(nMin) (when PlotStart=1). 2. It repeats this course. 1. Displaying the Graph Screen In Web format, press ... to display the graph screen. It moves vertically (up or down) to the sequence. 3. TI-83 Plus Sequence Graphing 194 Note: A potential convergence point occurs whenever a sequence intersects the y=x reference line. The TI-83 Plus: • Draws a y=x reference line in AxesOn format. • Plots the selected sequences with...

User Manual
Page 198
nMin=1 Xmin=0 Ymin=L10 nMax=25 Xmax=25 Ymax=10 PlotStart=1 Xscl=1 Yscl=1 PlotStep=1 TI-83 Plus Sequence Graphing 195 Press o in Seq mode to set Time axes format. 3. Press p and set to Illustrate Convergence Example: Convergence 1. Press y . Í to display the sequence Y= editor. Make sure the graph style is set the variables as shown below . Using Web Plots to í (dot), and then define nMin, u(n) and u(nMin) as shown below . 2.
nMin=1 Xmin=0 Ymin=L10 nMax=25 Xmax=25 Ymax=10 PlotStart=1 Xscl=1 Yscl=1 PlotStep=1 TI-83 Plus Sequence Graphing 195 Press o in Seq mode to set Time axes format. 3. Press p and set to Illustrate Convergence Example: Convergence 1. Press y . Í to display the sequence Y= editor. Make sure the graph style is set the variables as shown below . Using Web Plots to í (dot), and then define nMin, u(n) and u(nMin) as shown below . 2.

User Manual
Page 366
The illustration above and to determine the x-distance between the beginning and end of two ways. • Plot the data and trace to the right graphically depicts a complete period, or cycle. You can obtain a period guess in Alaska during one year. & & 1 period With noisy data, you will achieve better convergence results when you specify an accurate estimate for the number of hours of daylight in either of one complete period, or cycle. TI-83 Plus Statistics 363 SinReg Example: Daylight Hours in Alaska for One Year Compute the regression model for period.
The illustration above and to determine the x-distance between the beginning and end of two ways. • Plot the data and trace to the right graphically depicts a complete period, or cycle. You can obtain a period guess in Alaska during one year. & & 1 period With noisy data, you will achieve better convergence results when you specify an accurate estimate for the number of hours of daylight in either of one complete period, or cycle. TI-83 Plus Statistics 363 SinReg Example: Daylight Hours in Alaska for One Year Compute the regression model for period.

User Manual
Page 594
Press 150 Í. TI-83 Plus Activities 591 Press r. Y2=pB2 (the area of Y converges to p62, which is approximately 113.097. 11. Press 188 Í. The area of an N-sided regular polygon, with r as the distance from the center to a vertex, approaches the area of a circle with radius r (pr2) as X increases, the value of the circle) is plotted, press 100 Í to trace to Y1. After the graph is a horizontal asymptote to X=100. Notice that as N gets large.
Press 150 Í. TI-83 Plus Activities 591 Press r. Y2=pB2 (the area of Y converges to p62, which is approximately 113.097. 11. Press 188 Í. The area of an N-sided regular polygon, with r as the distance from the center to a vertex, approaches the area of a circle with radius r (pr2) as X increases, the value of the circle) is plotted, press 100 Í to trace to Y1. After the graph is a horizontal asymptote to X=100. Notice that as N gets large.

User Manual
Page 770
... 428, 657 chi-square test (c2.Test), 412, 657 Circle( (draw circle), 228, 657 Clear Entries, 596, 657 clearing all lists (ClrAllLists), 596, 657 TI-83 Plus Index drawing (ClrDraw), 217, 657 entries (Clear Entries), 596, 657 home screen (ClrHome), 532, 657 list (ClrList), 349, 658 table (ClrTable), 532, 658 ..., 463 concatenation (+), 490, 696 confidence intervals, 392 conj( (conjugate), 88, 658 Connected (plotting mode), 23, 658 connecting two calculators, 633 contrast (display), 8 convergence, sequence graphing, 195 conversions 767 Boxplot plot type ( Ö), 371 busy indicator, 11 -C-
... 428, 657 chi-square test (c2.Test), 412, 657 Circle( (draw circle), 228, 657 Clear Entries, 596, 657 clearing all lists (ClrAllLists), 596, 657 TI-83 Plus Index drawing (ClrDraw), 217, 657 entries (Clear Entries), 596, 657 home screen (ClrHome), 532, 657 list (ClrList), 349, 658 table (ClrTable), 532, 658 ..., 463 concatenation (+), 490, 696 confidence intervals, 392 conj( (conjugate), 88, 658 Connected (plotting mode), 23, 658 connecting two calculators, 633 contrast (display), 8 convergence, sequence graphing, 195 conversions 767 Boxplot plot type ( Ö), 371 busy indicator, 11 -C-

User Manual
Page 774
... 128, 662 ExprOn (expression on), 128, 662 -F- factorial (!), 94, 692 family of a cylinder, 497 examples-miscellaneous calculating outstanding loan balances, 456 convergence, 195 daylight hours in Alaska, 363 predator-prey model, 197 exponential regression (ExpReg), 361, 662 expr( (string-to a fraction, 542 displaying complex..., 166 roots of a function, 203 sending variables, 629 solving a system of linear equations, 256 unit circle, 246 TI-83 Plus Index volume of curves, 131 Fill(, 276, 663 FINANCE CALC menu, 446 FINANCE VARS menu, 462 financial functions amortization schedules, 454 771
... 128, 662 ExprOn (expression on), 128, 662 -F- factorial (!), 94, 692 family of a cylinder, 497 examples-miscellaneous calculating outstanding loan balances, 456 convergence, 195 daylight hours in Alaska, 363 predator-prey model, 197 exponential regression (ExpReg), 361, 662 expr( (string-to a fraction, 542 displaying complex..., 166 roots of a function, 203 sending variables, 629 solving a system of linear equations, 256 unit circle, 246 TI-83 Plus Index volume of curves, 131 Fill(, 276, 663 FINANCE CALC menu, 446 FINANCE VARS menu, 462 financial functions amortization schedules, 454 771
User Manual
Page 804
... Web 194 Using Web Plots to Illustrate Convergence 195 Example: Convergence 195 Graphing Phase Plots 197 Graphing with uv, vw, and uw 197 Example: Predator-Prey Model 197 Comparing TI-83 Plus and TI-82 Sequence Variables 201 Sequences and Window Variables 201 Keystroke Differences Between TI-83 Plus and TI-82 202 Sequence Keystroke Changes 202 Chapter... Up the Table from the Home Screen or a Program 206 Defining the Dependent Variables 207 Defining Dependent Variables from the Y= Editor 207 Editing Dependent Variables from the Table Editor 207 TI-83 Plus Quick-Find Locator xiii
... Web 194 Using Web Plots to Illustrate Convergence 195 Example: Convergence 195 Graphing Phase Plots 197 Graphing with uv, vw, and uw 197 Example: Predator-Prey Model 197 Comparing TI-83 Plus and TI-82 Sequence Variables 201 Sequences and Window Variables 201 Keystroke Differences Between TI-83 Plus and TI-82 202 Sequence Keystroke Changes 202 Chapter... Up the Table from the Home Screen or a Program 206 Defining the Dependent Variables 207 Defining Dependent Variables from the Y= Editor 207 Editing Dependent Variables from the Table Editor 207 TI-83 Plus Quick-Find Locator xiii