Reference Guide
Page 46
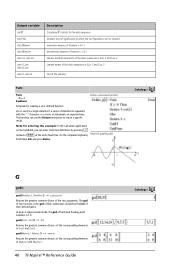
... the data sequences in List 1 and List 2 Sample means of the data sequences in Matrix1 and Matrix2. 40 TI-Nspire™ Reference Guide Catalog > Result of graphing g(x) Catalog > G gcd( ) gcd(Number1, Number2) ⇒ expression Returns the greatest common divisor of the corresponding ...of statements separated with the ":" character, or a series of fractional floating-point numbers is 1.0. Note for entering the example: In the Calculator application @ on separate lines. Output variable stat.F stat.PVal stat.dfNumer stat.dfDenom stat.sx1, stat.sx2 stat.x1_bar stat.x2_bar stat....
... the data sequences in List 1 and List 2 Sample means of the data sequences in Matrix1 and Matrix2. 40 TI-Nspire™ Reference Guide Catalog > Result of graphing g(x) Catalog > G gcd( ) gcd(Number1, Number2) ⇒ expression Returns the greatest common divisor of the corresponding ...of statements separated with the ":" character, or a series of fractional floating-point numbers is 1.0. Note for entering the example: In the Calculator application @ on separate lines. Output variable stat.F stat.PVal stat.dfNumer stat.dfDenom stat.sx1, stat.sx2 stat.x1_bar stat.x2_bar stat....
Reference Guide
Page 127
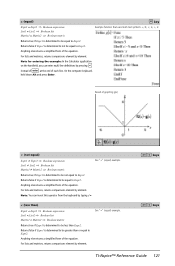
... and matrices, returns comparisons element by element. Note for entering the example: In the Calculator application @ on the handheld, you can insert this operator from the keyboard by typing...false if Expr1 is determined to be greater than Expr2. Anything else returns a simplified form of graphing g(x) ƒ (not equal) Expr1 ƒ Expr2 ⇒ Boolean expression List1 ƒ ...8658; Boolean matrix See "=" (equal) example. See "=" (equal) example. /= keys /= keys TI-Nspire™ Reference Guide 121 On the computer keyboard, hold down Alt and press Enter. Result of the equation....
... and matrices, returns comparisons element by element. Note for entering the example: In the Calculator application @ on the handheld, you can insert this operator from the keyboard by typing...false if Expr1 is determined to be greater than Expr2. Anything else returns a simplified form of graphing g(x) ƒ (not equal) Expr1 ƒ Expr2 ⇒ Boolean expression List1 ƒ ...8658; Boolean matrix See "=" (equal) example. See "=" (equal) example. /= keys /= keys TI-Nspire™ Reference Guide 121 On the computer keyboard, hold down Alt and press Enter. Result of the equation....
Reference Guide
Page 137
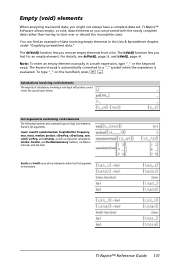
... ignore (skip) void elements found in the Lists & Spreadsheet chapter, under "Graphing spreadsheet data." Calculations involving void elements The majority of data involving empty elements in list arguments. TI-Nspire™ Reference Guide 131 The isVoid() function lets you remove empty elements from ...the keyword void. Empty (void) elements When analyzing real-world data, you can find an example of calculations involving a void input will produce a void result. TI-Nspire™ Software allows empty, or void, data elements so you might not always have a complete data set...
... ignore (skip) void elements found in the Lists & Spreadsheet chapter, under "Graphing spreadsheet data." Calculations involving void elements The majority of data involving empty elements in list arguments. TI-Nspire™ Reference Guide 131 The isVoid() function lets you remove empty elements from ...the keyword void. Empty (void) elements When analyzing real-world data, you can find an example of calculations involving a void input will produce a void result. TI-Nspire™ Software allows empty, or void, data elements so you might not always have a complete data set...
Data Collection Guidebook
Page 5
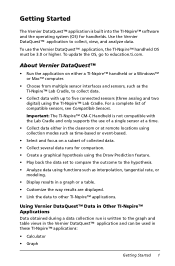
... sensors, such as time-based or event-based. • Select and focus on either in these TI-Nspire™ applications: • Calculator • Graph Getting Started 1 To use of a single sensor at remote locations using the TI-Nspire™ Lab Cradle. About Vernier DataQuest™ • Run the application on a subset of compatible sensors...
... sensors, such as time-based or event-based. • Select and focus on either in these TI-Nspire™ applications: • Calculator • Graph Getting Started 1 To use of a single sensor at remote locations using the TI-Nspire™ Lab Cradle. About Vernier DataQuest™ • Run the application on a subset of compatible sensors...
Data Collection Guidebook
Page 6
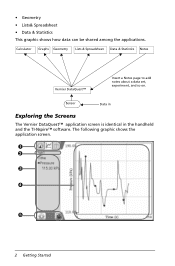
Sensor Data in Exploring the Screens The Vernier DataQuest™ application screen is identical in the handheld and the TI-Nspire™ software. Calculator Graphs Geometry Lists & Spreadsheet Data & Statistics Notes Vernier DataQuest™ Insert a Notes page to add notes about a data set, experiment, and so on. The following graphic shows the application screen. À Á Â Ã Ä 2 Getting Started • Geometry • Lists& Spreadsheet • Data & Statistics This graphic shows how data can be shared among the applications.
Sensor Data in Exploring the Screens The Vernier DataQuest™ application screen is identical in the handheld and the TI-Nspire™ software. Calculator Graphs Geometry Lists & Spreadsheet Data & Statistics Notes Vernier DataQuest™ Insert a Notes page to add notes about a data set, experiment, and so on. The following graphic shows the application screen. À Á Â Ã Ä 2 Getting Started • Geometry • Lists& Spreadsheet • Data & Statistics This graphic shows how data can be shared among the applications.
Data Collection Guidebook
Page 109
... removing 58 analyzing data curve fit 56 integral 54 model 58 statistics 55 tangent 53 applications Vernier DataQuest™ 1 axis ranges setting in graphs 29 C calculations derivative settings 73 collection modes average over 10 option 18 drop counting 16, 20 events with entry 14, 17 Photogate timing 16, 20...collections average over 10 option mode 18 drop counting mode 20 events with entry mode 17 in TI-Nspire ™ applications 79 Photogate timing mode 20 remote sensors 64 scaling graphs 33 selected events mode 19 setting sensor parameters 63 stopping 17, 79 thresholds 66 time-based mode 17...
... removing 58 analyzing data curve fit 56 integral 54 model 58 statistics 55 tangent 53 applications Vernier DataQuest™ 1 axis ranges setting in graphs 29 C calculations derivative settings 73 collection modes average over 10 option 18 drop counting 16, 20 events with entry 14, 17 Photogate timing 16, 20...collections average over 10 option mode 18 drop counting mode 20 events with entry mode 17 in TI-Nspire ™ applications 79 Photogate timing mode 20 remote sensors 64 scaling graphs 33 selected events mode 19 setting sensor parameters 63 stopping 17, 79 thresholds 66 time-based mode 17...
Getting Started
Page 34
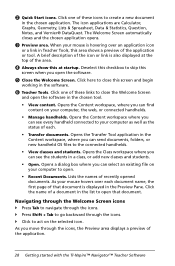
...your computer as well as the status of each document name, the first page of the application. 28 Getting started with the TI-Nspire™ Navigator™ Teacher Software As you can find content on your computer, the web, or connected handhelds. • Manage ...the top of these icons to the connected handhelds. • View classes and students. Click one of the application or tool. The icon applications are Calculator, Graphs, Geometry, Lists & Spreasheet, Data & Statistics, Question, Notes, and Vernier® DataQuest. Á Quick Start icons. Click one of the area...
...your computer as well as the status of each document name, the first page of the application. 28 Getting started with the TI-Nspire™ Navigator™ Teacher Software As you can find content on your computer, the web, or connected handhelds. • Manage ...the top of these icons to the connected handhelds. • View classes and students. Click one of the application or tool. The icon applications are Calculator, Graphs, Geometry, Lists & Spreasheet, Data & Statistics, Question, Notes, and Vernier® DataQuest. Á Quick Start icons. Click one of the area...

Teacher Software Guidebook
Page 40
Click one of the application. 28 Getting started with the TI-Nspire™ Navigator™ Teacher Software Navigating through the Welcome Screen icons ` Press Tab to navigate through the icons. ` Press Shift + Tab to act on the... a preview of these links to close this screen and begin working in a class, or add new classes and students. • Open. The icon applications are Calculator, Graphs, Geometry, Lists & Spreasheet, Data & Statistics, Question, Notes, and Vernier® DataQuest. Opens the Content workspace, where you can see the students in the software. Å...
Click one of the application. 28 Getting started with the TI-Nspire™ Navigator™ Teacher Software Navigating through the Welcome Screen icons ` Press Tab to navigate through the icons. ` Press Shift + Tab to act on the... a preview of these links to close this screen and begin working in a class, or add new classes and students. • Open. The icon applications are Calculator, Graphs, Geometry, Lists & Spreasheet, Data & Statistics, Question, Notes, and Vernier® DataQuest. Opens the Content workspace, where you can see the students in the software. Å...
Teacher Software Guidebook
Page 198
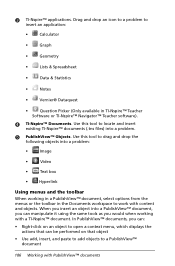
... select options from the menus or the toolbar in TI-Nspire™ Teacher Software or TI-Nspire™ Navigator™ Teacher software). Ã TI-Nspire™ Documents. Use this tool to locate and insert existing TI-Nspire™ documents (.tns files) into a PublishView™ ...actions that can be performed on that object • Use add, insert, and paste to add objects to insert an application: • Calculator • Graph • Geometry • Lists & Spreadsheet • Data & Statistics • Notes • Vernier® Dataquest • Question Picker...
... select options from the menus or the toolbar in TI-Nspire™ Teacher Software or TI-Nspire™ Navigator™ Teacher software). Ã TI-Nspire™ Documents. Use this tool to locate and insert existing TI-Nspire™ documents (.tns files) into a PublishView™ ...actions that can be performed on that object • Use add, insert, and paste to add objects to insert an application: • Calculator • Graph • Geometry • Lists & Spreadsheet • Data & Statistics • Notes • Vernier® Dataquest • Question Picker...
Teacher Software Guidebook
Page 395
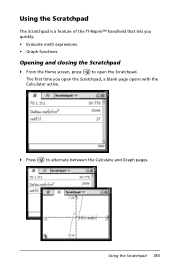
Using the Scratchpad The Scratchpad is a feature of the TI-Nspire™ handheld that lets you open the Scratchpad, a blank page opens with the Calculator active. ` Press » to open the Scratchpad. Using the Scratchpad 383 Opening and closing the Scratchpad ` From the Home screen, press » to alternate between the Calculate and Graph pages. The first time you quickly: • Evaluate math expressions. • Graph functions.
Using the Scratchpad The Scratchpad is a feature of the TI-Nspire™ handheld that lets you open the Scratchpad, a blank page opens with the Calculator active. ` Press » to open the Scratchpad. Using the Scratchpad 383 Opening and closing the Scratchpad ` From the Home screen, press » to alternate between the Calculate and Graph pages. The first time you quickly: • Evaluate math expressions. • Graph functions.
Teacher Software Guidebook
Page 396
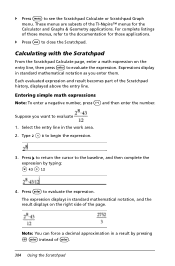
... the right side of the page. Each evaluated expression and result becomes part of the TI-Nspire™ menus for those applications. ` Press d to see the Scratchpad Calculate or Scratchpad Graph menu. Suppose you enter them. Press ¢ to return the cursor to the baseline, ...and then complete the expression by pressing / · instead of those menus, refer to the documentation for the Calculator and Graphs & Geometry applications. Entering simple math expressions Note: To enter a negative number, press v and then enter the number. Press · ...
... the right side of the page. Each evaluated expression and result becomes part of the TI-Nspire™ menus for those applications. ` Press d to see the Scratchpad Calculate or Scratchpad Graph menu. Suppose you enter them. Press ¢ to return the cursor to the baseline, ...and then complete the expression by pressing / · instead of those menus, refer to the documentation for the Calculator and Graphs & Geometry applications. Entering simple math expressions Note: To enter a negative number, press v and then enter the number. Press · ...
Teacher Software Guidebook
Page 407
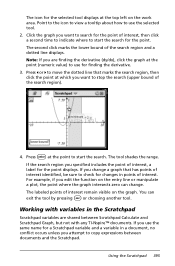
...shades the range. The labeled points of interest identified, be sure to use the selected tool. 2. Working with any TI-Nspire™ documents. You can change a graph that marks the search region, then click the point at which you want to use for finding the derivative. 3. If the...region and a dotted line displays. The icon for the selected tool displays at the top left on the graph. If you want to copy expressions between Scratchpad Calculate and Scratchpad Graph, but not with variables in a document, no conflict occurs unless you edit the function on the entry ...
...shades the range. The labeled points of interest identified, be sure to use the selected tool. 2. Working with any TI-Nspire™ documents. You can change a graph that marks the search region, then click the point at which you want to use for finding the derivative. 3. If the...region and a dotted line displays. The icon for the selected tool displays at the top left on the graph. If you want to copy expressions between Scratchpad Calculate and Scratchpad Graph, but not with variables in a document, no conflict occurs unless you edit the function on the entry ...
Teacher Software Guidebook
Page 408
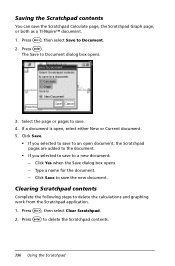
... the new document. Type a name for the document. - Clearing Scratchpad contents Complete the following steps to Document dialog box opens. 3. The Save to delete the calculations and graphing work from the Scratchpad application. 1. Press ~, then select Clear Scratchpad. 2. Press · to a new document: - Press ·. Click Save. • If you ... are added to the document. • If you selected to save . 4. Select the page or pages to Document. 2. Click Save to save the Scratchpad Calculate page, the Scratchpad Graph page, or both as a TI-Nspire™ document. 1.
... the new document. Type a name for the document. - Clearing Scratchpad contents Complete the following steps to Document dialog box opens. 3. The Save to delete the calculations and graphing work from the Scratchpad application. 1. Press ~, then select Clear Scratchpad. 2. Press · to a new document: - Press ·. Click Save. • If you ... are added to the document. • If you selected to save . 4. Select the page or pages to Document. 2. Click Save to save the Scratchpad Calculate page, the Scratchpad Graph page, or both as a TI-Nspire™ document. 1.
Teacher Software Guidebook
Page 409
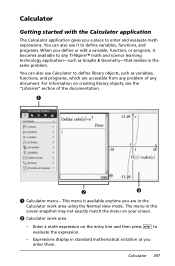
.... - Enter a math expression on creating library objects, see the "Libraries" section of any document. Calculator Getting started with the Calculator application The Calculator application gives you a place to any TI-Nspire™ math and science learning technology application-such as Graphs & Geometry-that resides in the same problem. For information on the entry line and...
.... - Enter a math expression on creating library objects, see the "Libraries" section of any document. Calculator Getting started with the Calculator application The Calculator application gives you a place to any TI-Nspire™ math and science learning technology application-such as Graphs & Geometry-that resides in the same problem. For information on the entry line and...
Teacher Software Guidebook
Page 423
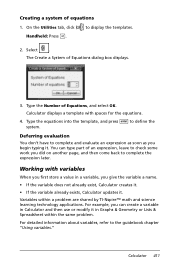
Calculator displays a template with variables When you first store a value in Graphs & Geometry or Lists & Spreadsheet within a problem are shared by TI-Nspire™ math and science learning technology applications. Working with spaces for the equations. 4. For detailed information about variables, ...the same problem. to complete and evaluate an expression as soon as you can type part of Equations, and select OK. Calculator 411 Deferring evaluation You don't have to display the templates. 2. Creating a system of Equations dialog box displays. 3. You can create ...
Calculator displays a template with variables When you first store a value in Graphs & Geometry or Lists & Spreadsheet within a problem are shared by TI-Nspire™ math and science learning technology applications. Working with spaces for the equations. 4. For detailed information about variables, ...the same problem. to complete and evaluate an expression as soon as you can type part of Equations, and select OK. Calculator 411 Deferring evaluation You don't have to display the templates. 2. Creating a system of Equations dialog box displays. 3. You can create ...
Teacher Software Guidebook
Page 437
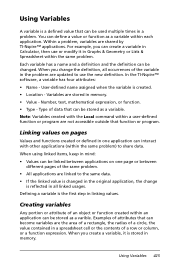
For example, you can create a variable in Calculator, then use the new definition. User-defined name assigned ...can define a value or function as a variable within the same problem. When you create a variable, it in Graphs & Geometry or Lists & Spreadsheet within each application. Variables are stored in linking values. Linking values on one ...application can interact with the Local command within a user-defined function or program are shared by TI-Nspire™ applications. Examples of attributes that can be stored as a variable. Defining a variable is the first...
For example, you can create a variable in Calculator, then use the new definition. User-defined name assigned ...can define a value or function as a variable within the same problem. When you create a variable, it in Graphs & Geometry or Lists & Spreadsheet within each application. Variables are stored in linking values. Linking values on one ...application can interact with the Local command within a user-defined function or program are shared by TI-Nspire™ applications. Examples of attributes that can be stored as a variable. Defining a variable is the first...
Teacher Software Guidebook
Page 553
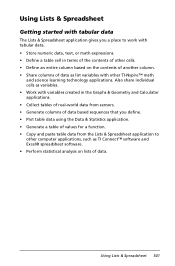
... application to work with tabular data. • Store numeric data, text, or math expressions. • Define a table cell in the Graphs & Geometry and Calculator applications. • Collect tables of real-world data from sensors. • Generate columns of data based sequences that you a place to ... columns of data as variables. • Work with other cells. • Define an entire column based on lists of other TI-Nspire™ math and science learning technology applications. Also share individual cells as list variables with variables created in terms of the contents of...
... application to work with tabular data. • Store numeric data, text, or math expressions. • Define a table cell in the Graphs & Geometry and Calculator applications. • Collect tables of real-world data from sensors. • Generate columns of data based sequences that you a place to ... columns of data as variables. • Work with other cells. • Define an entire column based on lists of other TI-Nspire™ math and science learning technology applications. Also share individual cells as list variables with variables created in terms of the contents of...
Teacher Software Guidebook
Page 558
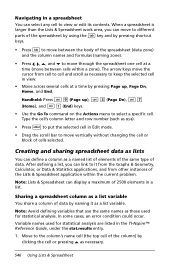
...defining a list, you can link to cell and scroll as a list variable You share a column of data by naming it from the Graphs & Geometry, Calculator, or Data & Statistics applications, and from other instances of the Lists & Spreadsheet application within a zone). Note: Avoid defining variables that .... Sharing a spreadsheet column as necessary to view or edit its contents. Variable names used for statistical analysis are listed in the TI-Nspire™ Reference Guide, under the stat.results entry. 1. When a spreadsheet is larger than the Lists & Spreadsheet work area, you...
...defining a list, you can link to cell and scroll as a list variable You share a column of data by naming it from the Graphs & Geometry, Calculator, or Data & Statistics applications, and from other instances of the Lists & Spreadsheet application within a zone). Note: Avoid defining variables that .... Sharing a spreadsheet column as necessary to view or edit its contents. Variable names used for statistical analysis are listed in the TI-Nspire™ Reference Guide, under the stat.results entry. 1. When a spreadsheet is larger than the Lists & Spreadsheet work area, you...
Teacher Software Guidebook
Page 559
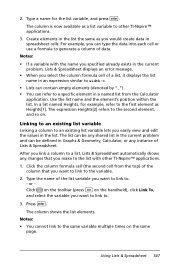
...to link to the same variable multiple times on . 2. Type a name for example, refer to the first element as a list variable to other TI-Nspire™ applications. 1. Use the list name and the element's position within the list. The expression Heights[2] refers to the variable. 2. Click on the... toolbar (press h on the handheld), click Link To, and select the variable you easily view and edit the values in Graphs & Geometry, Calculator, or any shared list in the current problem and can be defined in the list. Linking to an existing list variable Linking a column to...
...to link to the same variable multiple times on . 2. Type a name for example, refer to the first element as a list variable to other TI-Nspire™ applications. 1. Use the list name and the element's position within the list. The expression Heights[2] refers to the variable. 2. Click on the... toolbar (press h on the handheld), click Link To, and select the variable you easily view and edit the values in Graphs & Geometry, Calculator, or any shared list in the current problem and can be defined in the list. Linking to an existing list variable Linking a column to...
Teacher Software Guidebook
Page 609
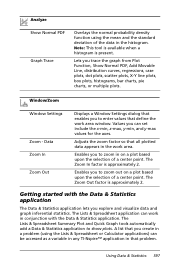
... X-Y line plots, box plots, histograms, bar charts, pie charts, or multiple plots. Enables you explore and visualize data and graph inferential statistics. Using Data & Statistics 597 Adjusts the zoom factor so that all plotted data appears in that problem. The Zoom Out... application. The Lists & Spreadsheet application can work in the histogram. Analyze Show Normal PDF Graph Trace Overlays the normal probability density function using the Lists & Spreadsheet or Calculator applications) can be accessed as a variable in any TI-Nspire™ application in the work area.
... X-Y line plots, box plots, histograms, bar charts, pie charts, or multiple plots. Enables you explore and visualize data and graph inferential statistics. Using Data & Statistics 597 Adjusts the zoom factor so that all plotted data appears in that problem. The Zoom Out... application. The Lists & Spreadsheet application can work in the histogram. Analyze Show Normal PDF Graph Trace Overlays the normal probability density function using the Lists & Spreadsheet or Calculator applications) can be accessed as a variable in any TI-Nspire™ application in the work area.


