Data Collection Guidebook
Page 49
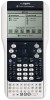
...to list to link to the symbol table and make this information available to improve system performance. 10. For more information, see Adjusting Derivative Settings. 1. The Column Options dialog box opens. This column can add an additional column to the table. Important: Heart rate and blood... pressure sensors require a tremendous amount of the existing columns. Use a calculated column when finding the derivative for most sensors. Note: Linking is to be useful, and the default for these sensors is the default for pH data. Analyzing ...
...to list to link to the symbol table and make this information available to improve system performance. 10. For more information, see Adjusting Derivative Settings. 1. The Column Options dialog box opens. This column can add an additional column to the table. Important: Heart rate and blood... pressure sensors require a tremendous amount of the existing columns. Use a calculated column when finding the derivative for most sensors. Note: Linking is to be useful, and the default for these sensors is the default for pH data. Analyzing ...
Data Collection Guidebook
Page 77
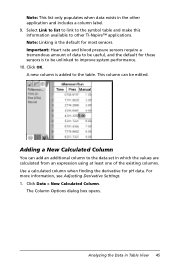
... start the playback and save the settings. • Click OK to save the settings. Find pH derivative settings using a calculated column. A higher value is faster, and a lower value is reached. Adjusting Derivative Settings Use this option to select the number of the following options: • Click Start... to start the playback and save the settings for this option to be selected and paused for use in derivative calculations. Select one point until the last point is slower. 4. The playback must be available. To advance the paused playback: ...
... start the playback and save the settings. • Click OK to save the settings. Find pH derivative settings using a calculated column. A higher value is faster, and a lower value is reached. Adjusting Derivative Settings Use this option to select the number of the following options: • Click Start... to start the playback and save the settings for this option to be selected and paused for use in derivative calculations. Select one point until the last point is slower. 4. The playback must be available. To advance the paused playback: ...
Data Collection Guidebook
Page 109
...analyzing data curve fit 56 integral 54 model 58 statistics 55 tangent 53 applications Vernier DataQuest™ 1 axis ranges setting in graphs 29 C calculations derivative settings 73 collection modes average over 10 option 18 drop counting 16, 20 events with entry 14, 17 Photogate timing 16, 20 selected events 15... selected events mode 19 setting sensor parameters 63 stopping 17, 79 thresholds 66 time-based mode 17 viewing 81 data markers 14 data plots finding curve fit 56 data set selection tool 3 data sets creating 42 renaming 42 selecting for replays 72 selecting to plot 32 storing 21 data...
...analyzing data curve fit 56 integral 54 model 58 statistics 55 tangent 53 applications Vernier DataQuest™ 1 axis ranges setting in graphs 29 C calculations derivative settings 73 collection modes average over 10 option 18 drop counting 16, 20 events with entry 14, 17 Photogate timing 16, 20 selected events 15... selected events mode 19 setting sensor parameters 63 stopping 17, 79 thresholds 66 time-based mode 17 viewing 81 data markers 14 data plots finding curve fit 56 data set selection tool 3 data sets creating 42 renaming 42 selecting for replays 72 selecting to plot 32 storing 21 data...

Teacher Software Guidebook
Page 406
... in Graph Trace mode by choosing another , or to show the area being traced. 4. Choose a tool to find zero, the minimum or maximum, the point of intersection or inflection, or the numeric derivative (dy/dx) or Integral on the point of the new graph or plot with a function. 3. The trace ...cursor is not defined for the function. Notes: • When you select or trace a function on the Analyze Graph menu to find a point of interest in a ...
... in Graph Trace mode by choosing another , or to show the area being traced. 4. Choose a tool to find zero, the minimum or maximum, the point of intersection or inflection, or the numeric derivative (dy/dx) or Integral on the point of the new graph or plot with a function. 3. The trace ...cursor is not defined for the function. Notes: • When you select or trace a function on the Analyze Graph menu to find a point of interest in a ...
Teacher Software Guidebook
Page 407
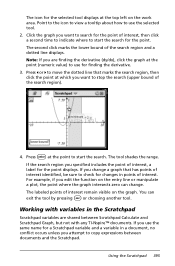
... 3 or 4 to move the dotted line that has points of interest identified, be sure to use for changes in the Scratchpad Scratchpad variables are finding the derivative (dy/dx), click the graph at the point (numeric value) to start the search for the selected tool displays at the point to use the... selected tool. 2. The labeled points of the search region and a dotted line displays. Point to the icon to view a tooltip about how to check for finding the derivative. 3. Working with variables in points of the search region). 4. The icon for the point.
... 3 or 4 to move the dotted line that has points of interest identified, be sure to use for changes in the Scratchpad Scratchpad variables are finding the derivative (dy/dx), click the graph at the point (numeric value) to start the search for the selected tool displays at the point to use the... selected tool. 2. The labeled points of the search region and a dotted line displays. Point to the icon to view a tooltip about how to check for finding the derivative. 3. Working with variables in points of the search region). 4. The icon for the point.

Teacher Software Guidebook
Page 458
... Point(s) Line Segment Constructs a point defined in free space or on a defined object. Constructs a segment, defined by a point and a direction. Finds the integral over a specified bound. Constructs a point at the intersection of inflection within the specified range). You can press g while creating a line to ...points or by two end points, which the selected function intersects another (if such a point exists within the specified range. Finds the derivative at which may be created or defined in free space, on an object, or at each intersection of two selected objects...
... Point(s) Line Segment Constructs a point defined in free space or on a defined object. Constructs a segment, defined by a point and a direction. Finds the integral over a specified bound. Constructs a point at the intersection of inflection within the specified range). You can press g while creating a line to ...points or by two end points, which the selected function intersects another (if such a point exists within the specified range. Finds the derivative at which may be created or defined in free space, on an object, or at each intersection of two selected objects...

Teacher Software Guidebook
Page 485
.... 2. Point to the icon to the entry line. The icon for the point of interest. If you are finding the derivative, click the graph at the point at which you want to find the point of inflection. 1. Graphs & Geometry 473 The list displays relations in a specified range of a function graph... tools on the work area. Choose a tool to search for the selected tool displays at the top left on the Analyze Graph menu to find the derivative. - For example, select Minimum to display a history of the relations typed on the Analyze Graph menu. Displaying relation history Show the entry ...
.... 2. Point to the icon to the entry line. The icon for the point of interest. If you are finding the derivative, click the graph at the point at which you want to find the point of inflection. 1. Graphs & Geometry 473 The list displays relations in a specified range of a function graph... tools on the work area. Choose a tool to search for the selected tool displays at the top left on the Analyze Graph menu to find the derivative. - For example, select Minimum to display a history of the relations typed on the Analyze Graph menu. Displaying relation history Show the entry ...

Teacher Software Guidebook
Page 504
... vertical symmetry of the graph. Click the point on the graph to help visualize the slope and then use the Measurement menu to find the derivative. 492 Graphs & Geometry Finding the derivative at which you could create a tangent on the graph at a point (the slope) This method uses the Analyze Graph menu. Alternatively, you...
... vertical symmetry of the graph. Click the point on the graph to help visualize the slope and then use the Measurement menu to find the derivative. 492 Graphs & Geometry Finding the derivative at which you could create a tangent on the graph at a point (the slope) This method uses the Analyze Graph menu. Alternatively, you...

Teacher Software Guidebook
Page 505
... function in a split screen, showing columns of values for multiple functions, and edit the expression that defines a function. Graphs & Geometry 493 The value of the derivative at a specific value of x or y, use the context menu of the point to Using Lists & Spreadsheet. Viewing function tables You can change the settings for... values for the currently defined functions. The table displays in the current problem. Showing the table ` From the View menu, select Show Table. Note: To find the derivative at the selected point displays on the graph.
... function in a split screen, showing columns of values for multiple functions, and edit the expression that defines a function. Graphs & Geometry 493 The value of the derivative at a specific value of x or y, use the context menu of the point to Using Lists & Spreadsheet. Viewing function tables You can change the settings for... values for the currently defined functions. The table displays in the current problem. Showing the table ` From the View menu, select Show Table. Note: To find the derivative at the selected point displays on the graph.

Teacher Software Guidebook
Page 856
deleting functions 488 deleting images 175, 214 DelVar, delete variable 691 derivative finding the 492 Destination folder editing 78 differential equations, graphing 480 dilating an object 525 Dilation tool 526 Disp, for debugging 701 display Disp command 689 ...
deleting functions 488 deleting images 175, 214 DelVar, delete variable 691 derivative finding the 492 Destination folder editing 78 differential equations, graphing 480 dilating an object 525 Dilation tool 526 Disp, for debugging 701 display Disp command 689 ...

Teacher Software Guidebook
Page 858
text in Program Editor 683 finding and replacing text in Program Editor 683 finding points of interest 492, 522 finding the derivative (slope) of a function 492 folder Publishview(TM) objects 216 folders creating 126 footers inserting text 201 for, For 694, 697 format text 648 formatting text ...
text in Program Editor 683 finding and replacing text in Program Editor 683 finding points of interest 492, 522 finding the derivative (slope) of a function 492 folder Publishview(TM) objects 216 folders creating 126 footers inserting text 201 for, For 694, 697 format text 648 formatting text ...

Teacher Software Guidebook
Page 869
... PublishView(TM) 199 showing warnings and errors 654 slider animating a 3D graph 538 using to adjust a variable 465 sliders 636 sliders (Data & Statisitcs) 595 slope finding the derivative of a function 492 of a line 517 of a ray 517 of a segment 517 of all the newest features and functionality. 857
... PublishView(TM) 199 showing warnings and errors 654 slider animating a 3D graph 538 using to adjust a variable 465 sliders 636 sliders (Data & Statisitcs) 595 slope finding the derivative of a function 492 of a line 517 of a ray 517 of a segment 517 of all the newest features and functionality. 857


