Reference Guide
Page 46
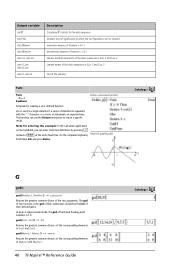
...press Enter. gcd(Matrix1, Matrix2) ⇒ matrix Returns the greatest common divisors of the corresponding elements in List1 and List2. Result of graphing g(x) Catalog > G gcd( ) gcd(Number1, Number2) ⇒ expression Returns the greatest common divisor of fractional floating-point numbers is ...in List 1 and List 2 Size of the samples Func Func Block EndFunc Define a piecewise function: Template for entering the example: In the Calculator application @ on separate lines. The function can be a single statement, a series of statements separated with the ":" character, or a series...
...press Enter. gcd(Matrix1, Matrix2) ⇒ matrix Returns the greatest common divisors of the corresponding elements in List1 and List2. Result of graphing g(x) Catalog > G gcd( ) gcd(Number1, Number2) ⇒ expression Returns the greatest common divisor of fractional floating-point numbers is ...in List 1 and List 2 Size of the samples Func Func Block EndFunc Define a piecewise function: Template for entering the example: In the Calculator application @ on separate lines. The function can be a single statement, a series of statements separated with the ":" character, or a series...
Reference Guide
Page 127
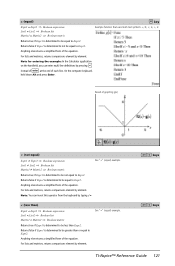
...equal to Expr2. Returns false if Expr1 is determined to be greater than or equal to Expr2. Note for entering the example: In the Calculator application @ on the handheld, you can insert this operator from the keyboard by element. Result of each line. Anything else returns a ... to be equal to be not equal to Expr2. Note: You can enter multi-line definitions by pressing · instead of at the end of graphing g(x) ƒ (not equal) Expr1 ƒ Expr2 ⇒ Boolean expression List1 ƒ List2 ⇒ Boolean list Matrix1 ƒ Matrix2 ⇒ Boolean matrix See ...
...equal to Expr2. Returns false if Expr1 is determined to be greater than or equal to Expr2. Note for entering the example: In the Calculator application @ on the handheld, you can insert this operator from the keyboard by element. Result of each line. Anything else returns a ... to be equal to be not equal to Expr2. Note: You can enter multi-line definitions by pressing · instead of at the end of graphing g(x) ƒ (not equal) Expr1 ƒ Expr2 ⇒ Boolean expression List1 ƒ List2 ⇒ Boolean list Matrix1 ƒ Matrix2 ⇒ Boolean matrix See ...
Reference Guide
Page 137
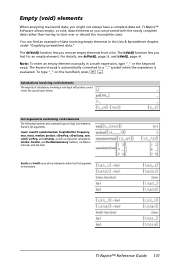
... math expression, type "_" or the keyword void. TI-Nspire™ Reference Guide 131 Calculations involving void elements The majority of data involving empty elements in the Lists & Spreadsheet chapter, under "Graphing spreadsheet data." To type "_" on the handheld, press / _. Empty (void) elements... When analyzing real-world data, you can find an example of calculations involving a void input will produce a void result. For details...
... math expression, type "_" or the keyword void. TI-Nspire™ Reference Guide 131 Calculations involving void elements The majority of data involving empty elements in the Lists & Spreadsheet chapter, under "Graphing spreadsheet data." To type "_" on the handheld, press / _. Empty (void) elements... When analyzing real-world data, you can find an example of calculations involving a void input will produce a void result. For details...
Data Collection Guidebook
Page 3
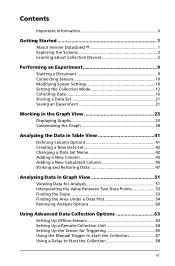
...Settings 10 Setting the Collection Mode 12 Collecting Data 16 Storing a Data Set 21 Saving an Experiment 21 Working in the Graph View 23 Displaying Graphs 23 Customizing the Graph 28 Analyzing the Data in Table View 41 Defining Column Options 41 Creating a New Data Set 42 Changing a Data Set... Name 42 Adding a New Column 43 Adding a New Calculated Column 45 Striking and Restoring Data 47 Analyzing Data in Graph View 51 Viewing Data for Analysis 51 Interpolating the Value Between Two Data Points 53 Finding the Slope 53 Finding...
...Settings 10 Setting the Collection Mode 12 Collecting Data 16 Storing a Data Set 21 Saving an Experiment 21 Working in the Graph View 23 Displaying Graphs 23 Customizing the Graph 28 Analyzing the Data in Table View 41 Defining Column Options 41 Creating a New Data Set 42 Changing a Data Set... Name 42 Adding a New Column 43 Adding a New Calculated Column 45 Striking and Restoring Data 47 Analyzing Data in Graph View 51 Viewing Data for Analysis 51 Interpolating the Value Between Two Data Points 53 Finding the Slope 53 Finding...
Data Collection Guidebook
Page 5
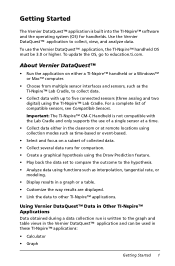
... five connected sensors (three analog and two digital) using functions such as interpolation, tangential rate, or modeling. • Display results in a graph or a table. • Customize the way results are displayed. • Link the data to other TI-Nspire™ applications. Important: The...the Vernier DataQuest™ application, the TI-Nspire™ handheld OS must be used in these TI-Nspire™ applications: • Calculator • Graph Getting Started 1 To update the OS, go to collect, view, and analyze data. Use the Vernier DataQuest™ application to education...
... five connected sensors (three analog and two digital) using functions such as interpolation, tangential rate, or modeling. • Display results in a graph or a table. • Customize the way results are displayed. • Link the data to other TI-Nspire™ applications. Important: The...the Vernier DataQuest™ application, the TI-Nspire™ handheld OS must be used in these TI-Nspire™ applications: • Calculator • Graph Getting Started 1 To update the OS, go to collect, view, and analyze data. Use the Vernier DataQuest™ application to education...
Data Collection Guidebook
Page 6
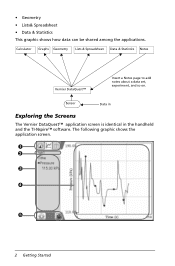
• Geometry • Lists& Spreadsheet • Data & Statistics This graphic shows how data can be shared among the applications. Sensor Data in Exploring the Screens The Vernier DataQuest™ application screen is identical in the handheld and the TI-Nspire™ software. Calculator Graphs Geometry Lists & Spreadsheet Data & Statistics Notes Vernier DataQuest™ Insert a Notes page to add notes about a data set, experiment, and so on. The following graphic shows the application screen. À Á Â Ã Ä 2 Getting Started
• Geometry • Lists& Spreadsheet • Data & Statistics This graphic shows how data can be shared among the applications. Sensor Data in Exploring the Screens The Vernier DataQuest™ application screen is identical in the handheld and the TI-Nspire™ software. Calculator Graphs Geometry Lists & Spreadsheet Data & Statistics Notes Vernier DataQuest™ Insert a Notes page to add notes about a data set, experiment, and so on. The following graphic shows the application screen. À Á Â Ã Ä 2 Getting Started

Data Collection Guidebook
Page 59
The values are calculated. Analyzing Data in the All Details for all the data, or select a range to determine the statistics associated with the plotted data. Review the data. ... data. For example, run1.Pressure. For information on clearing the Integral analysis, see Removing Analysis Options. Click Analyze > Statistics. 3. You can find the statistics for Graph dialog box. Leave the graph unselected to examine all the data or a selected region of samples are displayed in the View details area and in...
The values are calculated. Analyzing Data in the All Details for all the data, or select a range to determine the statistics associated with the plotted data. Review the data. ... data. For example, run1.Pressure. For information on clearing the Integral analysis, see Removing Analysis Options. Click Analyze > Statistics. 3. You can find the statistics for Graph dialog box. Leave the graph unselected to examine all the data or a selected region of samples are displayed in the View details area and in...

Data Collection Guidebook
Page 60
... match the data. Curve Fit option Linear Quadratic Cubic Quartic Power (ax^b) Exponential (ab^x) Logarithmic Sinusoidal Logistic (d 0) Natural Exponential Proportional Calculated in the form: y = m*x + b y = a*x^2 + b*x + c y = a*x^3 + b*x^2 + c*x + d y = a*x^4 + b*x^3 + c*x^2 + d*x + e y = a*x^b y = a*b^x y = a + b*ln(x) y = a*sin(b*x + c) + d y = c/(1 + a*e^(-bx)) + d y = a*e^(-c*x) y = a*x 56 Analyzing Data in Graph View For information on the graph. The Model dialog box is drawn on clearing the Statistics analysis, see Removing Analysis Options. 5.
... match the data. Curve Fit option Linear Quadratic Cubic Quartic Power (ax^b) Exponential (ab^x) Logarithmic Sinusoidal Logistic (d 0) Natural Exponential Proportional Calculated in the form: y = m*x + b y = a*x^2 + b*x + c y = a*x^3 + b*x^2 + c*x + d y = a*x^4 + b*x^3 + c*x^2 + d*x + e y = a*x^b y = a*b^x y = a + b*ln(x) y = a*sin(b*x + c) + d y = c/(1 + a*e^(-bx)) + d y = a*e^(-c*x) y = a*x 56 Analyzing Data in Graph View For information on the graph. The Model dialog box is drawn on clearing the Statistics analysis, see Removing Analysis Options. 5.

Data Collection Guidebook
Page 78
.... Drawing a Predictive Outcome Use this option to add points to the graph to predict the outcome of List B with respect to draw a prediction and you are using a calculated column. Note: The derivative calculation is found using . To draw the prediction: 74 Working with respect ...). The Vernier DataQuest™ application can remove the prediction. The numerical derivative is completely row based. Note: The first derivative calculation (weighted average) is what the Tangent tool uses to another list of data with Advanced Analysis Features The data can be sorted...
.... Drawing a Predictive Outcome Use this option to add points to the graph to predict the outcome of List B with respect to draw a prediction and you are using a calculated column. Note: The derivative calculation is found using . To draw the prediction: 74 Working with respect ...). The Vernier DataQuest™ application can remove the prediction. The numerical derivative is completely row based. Note: The first derivative calculation (weighted average) is what the Tangent tool uses to another list of data with Advanced Analysis Features The data can be sorted...
Data Collection Guidebook
Page 109
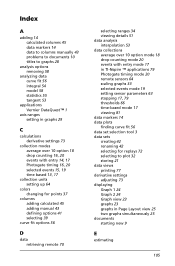
... removing 58 analyzing data curve fit 56 integral 54 model 58 statistics 55 tangent 53 applications Vernier DataQuest™ 1 axis ranges setting in graphs 29 C calculations derivative settings 73 collection modes average over 10 option 18 drop counting 16, 20 events with entry 14, 17 Photogate timing 16, 20... selected events 15, 19 time based 13, 17 collection units setting up 64 colors changing for points 37 columns adding calculated 45 adding manual 43 defining options 41 selecting 39 curve fit options 56 D data retrieving remote 70 selecting ranges 34 viewing details 51 data...
... removing 58 analyzing data curve fit 56 integral 54 model 58 statistics 55 tangent 53 applications Vernier DataQuest™ 1 axis ranges setting in graphs 29 C calculations derivative settings 73 collection modes average over 10 option 18 drop counting 16, 20 events with entry 14, 17 Photogate timing 16, 20... selected events 15, 19 time based 13, 17 collection units setting up 64 colors changing for points 37 columns adding calculated 45 adding manual 43 defining options 41 selecting 39 curve fit options 56 D data retrieving remote 70 selecting ranges 34 viewing details 51 data...
Getting Started
Page 34
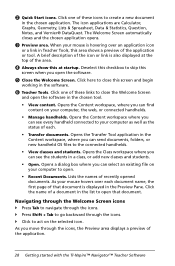
... at startup. Opens the Content workspace where you can see every handheld connected to create a new document in the chosen application. The icon applications are Calculator, Graphs, Geometry, Lists & Spreasheet, Data & Statistics, Question, Notes, and Vernier® DataQuest. Opens a dialog box where you can find content on the selected icon. As you...
... at startup. Opens the Content workspace where you can see every handheld connected to create a new document in the chosen application. The icon applications are Calculator, Graphs, Geometry, Lists & Spreasheet, Data & Statistics, Question, Notes, and Vernier® DataQuest. Opens a dialog box where you can find content on the selected icon. As you...

Getting Started
Page 114
... current document only, click OK. • To restore default settings, click Restore. • Click Cancel to customize the application settings for graphs and geometry. 1. Field Calculation Mode Vector Format Base Unit System (CAS) Value • Auto • CAS: Exact • Approximate Note: Auto mode displays an ...Document Settings to view the current settings. 108 Using the Documents Workspace Create a new document or open the Document Settings window. 3. Click Graphs & Geometry to open an existing document. 2. Use the mouse to click and select the desired setting. 5.
... current document only, click OK. • To restore default settings, click Restore. • Click Cancel to customize the application settings for graphs and geometry. 1. Field Calculation Mode Vector Format Base Unit System (CAS) Value • Auto • CAS: Exact • Approximate Note: Auto mode displays an ...Document Settings to view the current settings. 108 Using the Documents Workspace Create a new document or open the Document Settings window. 3. Click Graphs & Geometry to open an existing document. 2. Use the mouse to click and select the desired setting. 5.

Teacher Software Guidebook
Page 8
... 418 Financial calculations 419 Working with the Calculator history 421 Using Variables 425 Linking values on pages 425 Creating variables 425 Using (linking) variables 431 Naming variables 433 Locking and unlocking variables 435 Graphs & Geometry 439 Getting started with Graphs & Geometry 439 Graphs & Geometry menu 440 Using keystroke shortcuts 450 Using the context menu 451...
... 418 Financial calculations 419 Working with the Calculator history 421 Using Variables 425 Linking values on pages 425 Creating variables 425 Using (linking) variables 431 Naming variables 433 Locking and unlocking variables 435 Graphs & Geometry 439 Getting started with Graphs & Geometry 439 Graphs & Geometry menu 440 Using keystroke shortcuts 450 Using the context menu 451...
Teacher Software Guidebook
Page 9
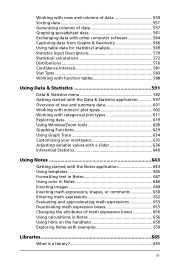
... 557 Generating columns of data 557 Graphing spreadsheet data 561 Exchanging data with other computer software 564 Capturing data from Graphs & Geometry 566 Using table data for statistical analysis 569 Statistics Input Descriptions 570 Statistical calculations 572 Distributions 576 Confidence Intervals 581... numeric plot types 602 Working with categorical plot types 611 Exploring data 619 Using Window/Zoom tools 628 Graphing Functions 629 Using Graph Trace 634 Customizing your workspace 635 Adjusting variable values with a slider 636 Inferential Statistics 640 Using Notes ...
... 557 Generating columns of data 557 Graphing spreadsheet data 561 Exchanging data with other computer software 564 Capturing data from Graphs & Geometry 566 Using table data for statistical analysis 569 Statistics Input Descriptions 570 Statistical calculations 572 Distributions 576 Confidence Intervals 581... numeric plot types 602 Working with categorical plot types 611 Exploring data 619 Using Window/Zoom tools 628 Graphing Functions 629 Using Graph Trace 634 Customizing your workspace 635 Adjusting variable values with a slider 636 Inferential Statistics 640 Using Notes ...

Teacher Software Guidebook
Page 11
...724 Starting a data collection 726 Using the Keep option 726 Stopping a collection 728 Analyzing data 728 Examining data points 728 Data analysis calculations 732 Removing analysis options 739 Examining the View Details area data 739 Showing and hiding details 742 Storing data 743 Saving an experiment ...743 Working with data and Graph View 743 Showing graphs 744 Adding a title to a graph 747 Setting min and max axis ranges 748 Selecting a Data Set to plot 751 Using autoscale 752 Using ...
...724 Starting a data collection 726 Using the Keep option 726 Stopping a collection 728 Analyzing data 728 Examining data points 728 Data analysis calculations 732 Removing analysis options 739 Examining the View Details area data 739 Showing and hiding details 742 Storing data 743 Saving an experiment ...743 Working with data and Graph View 743 Showing graphs 744 Adding a title to a graph 747 Setting min and max axis ranges 748 Selecting a Data Set to plot 751 Using autoscale 752 Using ...

Teacher Software Guidebook
Page 40
... where you can see the students in the software. Å Teacher Tools. As you can find content on the selected icon. The icon applications are Calculator, Graphs, Geometry, Lists & Spreasheet, Data & Statistics, Question, Notes, and Vernier® DataQuest. As your mouse is also displayed at startup. When your mouse hovers over an...
... where you can see the students in the software. Å Teacher Tools. As you can find content on the selected icon. The icon applications are Calculator, Graphs, Geometry, Lists & Spreasheet, Data & Statistics, Question, Notes, and Vernier® DataQuest. As your mouse is also displayed at startup. When your mouse hovers over an...

Teacher Software Guidebook
Page 108
... desired setting. 5. From the status bar, double-click Settings or select File > Settings > Document Settings to customize the application settings for graphs and geometry. 1. Choose one of the following steps to open an existing document. 2. Use the mouse to close the window without making ...displays an answer that is not a whole number as a fraction or in symbolic form, except when a decimal is used in the problem. Field Calculation Mode Vector Format Base Unit System (CAS) Value • Auto • CAS: Exact • Approximate Note: Auto mode displays an answer that...
... desired setting. 5. From the status bar, double-click Settings or select File > Settings > Document Settings to customize the application settings for graphs and geometry. 1. Choose one of the following steps to open an existing document. 2. Use the mouse to close the window without making ...displays an answer that is not a whole number as a fraction or in symbolic form, except when a decimal is used in the problem. Field Calculation Mode Vector Format Base Unit System (CAS) Value • Auto • CAS: Exact • Approximate Note: Auto mode displays an answer that...

Teacher Software Guidebook
Page 124
Insert a text box into a document. (The application must support images). Program Editor 8 Insert a new program; Text - or open, import, or view an existing program. 112 Using the Documents Workspace Toolbar icon Menu option and what you can do Page - Add a page to a problem with one of the following applications: Calculator Keyboard shortcut Windows®: Ctrl + I Macintosh®: ì" + I Graphs Geometry Lists & Spreadsheet Data & Statistics Notes Vernier DataQuest Question Image - Insert an image into a PublishView™ document.
Insert a text box into a document. (The application must support images). Program Editor 8 Insert a new program; Text - or open, import, or view an existing program. 112 Using the Documents Workspace Toolbar icon Menu option and what you can do Page - Add a page to a problem with one of the following applications: Calculator Keyboard shortcut Windows®: Ctrl + I Macintosh®: ì" + I Graphs Geometry Lists & Spreadsheet Data & Statistics Notes Vernier DataQuest Question Image - Insert an image into a PublishView™ document.
Teacher Software Guidebook
Page 198
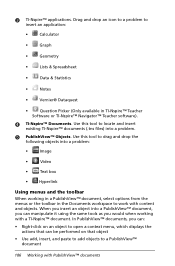
...; PublishView™ Objects. Use this tool to a PublishView™ document 186 Working with a TI-Nspire™ document. Use this tool to insert an application: • Calculator • Graph • Geometry • Lists & Spreadsheet • Data & Statistics • Notes • Vernier® Dataquest • Question Picker (Only available in the Documents workspace to...
...; PublishView™ Objects. Use this tool to a PublishView™ document 186 Working with a TI-Nspire™ document. Use this tool to insert an application: • Calculator • Graph • Geometry • Lists & Spreadsheet • Data & Statistics • Notes • Vernier® Dataquest • Question Picker (Only available in the Documents workspace to...
Teacher Software Guidebook
Page 395
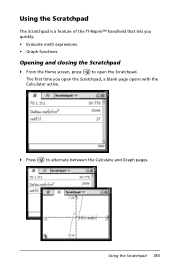
The first time you quickly: • Evaluate math expressions. • Graph functions. Using the Scratchpad The Scratchpad is a feature of the TI-Nspire™ handheld that lets you open the Scratchpad, a blank page opens with the Calculator active. ` Press » to open the Scratchpad. Opening and closing the Scratchpad ` From the Home screen, press » to alternate between the Calculate and Graph pages. Using the Scratchpad 383
The first time you quickly: • Evaluate math expressions. • Graph functions. Using the Scratchpad The Scratchpad is a feature of the TI-Nspire™ handheld that lets you open the Scratchpad, a blank page opens with the Calculator active. ` Press » to open the Scratchpad. Opening and closing the Scratchpad ` From the Home screen, press » to alternate between the Calculate and Graph pages. Using the Scratchpad 383


