Owners Manual
Page 3
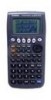
... ADJUSTING THE COLOR CONTRAST Use one distinct and easy to graphing complex equations. Quick-Start is shown graphically to help you 'll have mastered the basic operation -of the CFX-9800G and will be...CFX-9800G. Quick-Start Welcome to the world of -the two following'procedures to enter the number 57, for about s& minutes. Each step of the examples in blue. EExample) To draw a sine curve. • Dynamic Graph Display Y=A (x:II+5B ) +C fir ,' Ik,l ' YV` A=5 • Table & Graph Display 72 -2 I I 2 I You can use either of color graphing calculators and the CASIO CFX-9800G...
... ADJUSTING THE COLOR CONTRAST Use one distinct and easy to graphing complex equations. Quick-Start is shown graphically to help you 'll have mastered the basic operation -of the CFX-9800G and will be...CFX-9800G. Quick-Start Welcome to the world of -the two following'procedures to enter the number 57, for about s& minutes. Each step of the examples in blue. EExample) To draw a sine curve. • Dynamic Graph Display Y=A (x:II+5B ) +C fir ,' Ik,l ' YV` A=5 • Table & Graph Display 72 -2 I I 2 I You can use either of color graphing calculators and the CASIO CFX-9800G...
Owners Manual
Page 5
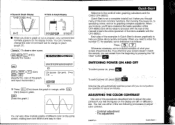
... initial screen of the COMP (computation) mode, where you can perform manual calculations, run programs, and draw graphs. Quick-Start IV Quick-Start V To enter the GRAPH Mode 1. Quick-Start USING MODES The CFX-9800G makes it easy to perform a Wide range of graph functions. n AMAIN MENUi833ne coriF BASE SD MAT GRAPHDYNA TABLE [MI ariNti i.ll...
... initial screen of the COMP (computation) mode, where you can perform manual calculations, run programs, and draw graphs. Quick-Start IV Quick-Start V To enter the GRAPH Mode 1. Quick-Start USING MODES The CFX-9800G makes it easy to perform a Wide range of graph functions. n AMAIN MENUi833ne coriF BASE SD MAT GRAPHDYNA TABLE [MI ariNti i.ll...
Owners Manual
Page 18
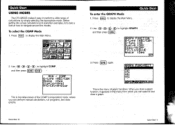
... the CASIO CFX-9800.G Color Power Graphic calculator. To learn all about the many powerful features of the Dynamic Graph. • One moment please! After you've completed this Quick-Start section, you are well on your way to start drawing of the CFX-9800G, read on and explore! Y-A(X+B)2+C • • • •'• S COLOR POWER GRAPHIC CFX-9800G A=1 y.A(x+cB...
... the CASIO CFX-9800.G Color Power Graphic calculator. To learn all about the many powerful features of the Dynamic Graph. • One moment please! After you've completed this Quick-Start section, you are well on your way to start drawing of the CFX-9800G, read on and explore! Y-A(X+B)2+C • • • •'• S COLOR POWER GRAPHIC CFX-9800G A=1 y.A(x+cB...
Owners Manual
Page 20
... Graphs r Graphing Built-in Scientific Functions Overdrawing Built-in Function Graphs Graphing Manually Entered Functions Overdrawing Manually Input Graphs Specifying the Graph Range 8-3 • Polar Coordinate Graphs Graphing Built-In Scientific Functions Graphing Manually Entered Functions • Specifying the Graph Range 8-4 Parametric.Graphs Specifying the Graph Range 8-5 Inequality Graphs Overdrawing Inequality Graphs Specifying the Graph Range 8-6 Integration Graphs 8-7 Probability Distribution Graphs 8-8 Single-Variable Statistical Graphs 8-9 Paired-Variable Statistical Graphs...
... Graphs r Graphing Built-in Scientific Functions Overdrawing Built-in Function Graphs Graphing Manually Entered Functions Overdrawing Manually Input Graphs Specifying the Graph Range 8-3 • Polar Coordinate Graphs Graphing Built-In Scientific Functions Graphing Manually Entered Functions • Specifying the Graph Range 8-4 Parametric.Graphs Specifying the Graph Range 8-5 Inequality Graphs Overdrawing Inequality Graphs Specifying the Graph Range 8-6 Integration Graphs 8-7 Probability Distribution Graphs 8-8 Single-Variable Statistical Graphs 8-9 Paired-Variable Statistical Graphs...

Owners Manual
Page 21
... 232 232 235 239 240 241 242 243 244 247 248 250 251 253 Contents 11 Chapter Table and Graph Mode 11-1 Entering the Table and Graph Mode 11-2 Generating a Table and Drawing a Graph for a Function Storing a Function and Generating a Numeric Table Editing a Function Function Linking Editing a Table List Deleting ... X-Axis for the Graph 255 256 257 257 262 264 264 267 267 269 271 271 271 273 277 279 279. 12 Chapter Program/File Editor Mode 12-1 Before Using the Program/File Editor Mode 12-2 Using the Program Mode Entering the Program Mode Specifying the Calculation Mode Selecting a Program...
... 232 232 235 239 240 241 242 243 244 247 248 250 251 253 Contents 11 Chapter Table and Graph Mode 11-1 Entering the Table and Graph Mode 11-2 Generating a Table and Drawing a Graph for a Function Storing a Function and Generating a Numeric Table Editing a Function Function Linking Editing a Table List Deleting ... X-Axis for the Graph 255 256 257 257 262 264 264 267 267 269 271 271 271 273 277 279 279. 12 Chapter Program/File Editor Mode 12-1 Before Using the Program/File Editor Mode 12-2 Using the Program Mode Entering the Program Mode Specifying the Calculation Mode Selecting a Program...
Owners Manual
Page 22
... Programs 314 12-13 Using the Graph Function in Programs 316 13 Chapter Data Communications 320 13-1 Connecting Two CDC:9800G Units 320 13-2 Connecting the CFX-9800G with a Personal Computer 321 13-3 Connecting the CFX-98006 to a CASIO Label Printer 321 13-4 Before Starting... Batteries Replacing Batteries About the Auto Power Off Function 345 346 346 346 348 Appendix B To Reset the Calculator Appendix C Function Reference Manual Calculations Program Calculations Appendix D Error Message Table Appendix E Input Ranges Appendix F Specifications Index Key Index Contents 349 351 351 ...
... Programs 314 12-13 Using the Graph Function in Programs 316 13 Chapter Data Communications 320 13-1 Connecting Two CDC:9800G Units 320 13-2 Connecting the CFX-9800G with a Personal Computer 321 13-3 Connecting the CFX-98006 to a CASIO Label Printer 321 13-4 Before Starting... Batteries Replacing Batteries About the Auto Power Off Function 345 346 346 346 348 Appendix B To Reset the Calculator Appendix C Function Reference Manual Calculations Program Calculations Appendix D Error Message Table Appendix E Input Ranges Appendix F Specifications Index Key Index Contents 349 351 351 ...
Owners Manual
Page 23
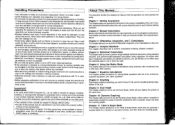
... of water and a neutral detergent and wrung out. •In no event shall CASIO Computer Co., Ltd. Chapter 10 Dynamic Graphing This chapter tells you are operating the keyboard, be sure to OFF when replacing batteries. • If the calculator is made up of function coefficients within a specific range, and draw the resulting...
... of water and a neutral detergent and wrung out. •In no event shall CASIO Computer Co., Ltd. Chapter 10 Dynamic Graphing This chapter tells you are operating the keyboard, be sure to OFF when replacing batteries. • If the calculator is made up of function coefficients within a specific range, and draw the resulting...

Owners Manual
Page 26
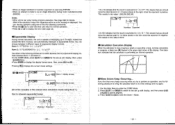
...the current display image to a connected personal computer or CASIO Label Printer (page 343). *When this key is set to function as a Mode Display Key (page 23), it can then execute the calculation again, or edit the calculation and then execute it from which the function was ... Keys *Use these keys to move the cursor on the display. •After you want to draw an integration graph. E21111 Graph/Differential Key *Press this key before entering a calculation formula for integration calculations. •Press this key following t I to enter the letter r. -16- 8 l= Range Key •...
...the current display image to a connected personal computer or CASIO Label Printer (page 343). *When this key is set to function as a Mode Display Key (page 23), it can then execute the calculation again, or edit the calculation and then execute it from which the function was ... Keys *Use these keys to move the cursor on the display. •After you want to draw an integration graph. E21111 Graph/Differential Key *Press this key before entering a calculation formula for integration calculations. •Press this key following t I to enter the letter r. -16- 8 l= Range Key •...

Owners Manual
Page 27
... name to assign the result of a calculation OFF All Clear/ON/OFF Key to the value memory. Any value outside this'range results in functions and 1I engineering symbols (k, µ, etc.) Ia E - Graph Color Menu This key operation displaysthe menu used for changing the color used for drawing a graph to orange or green from page...
... name to assign the result of a calculation OFF All Clear/ON/OFF Key to the value memory. Any value outside this'range results in functions and 1I engineering symbols (k, µ, etc.) Ia E - Graph Color Menu This key operation displaysthe menu used for changing the color used for drawing a graph to orange or green from page...

Owners Manual
Page 28
... mode you can control the operations of the unit by inputting a number or letter. PRGM Mode Use this mode for arithmetic calculations and function calculations for drawing graphs and for executing programs. BASE 2616E • To change , and to select the mode you want . Use the cursor ...Displays •Use only the procedures described above to adjust the color contrast of a mode has an effect on the calculation results it produces. oln addition to using the cursor keys to input functions and draw their graphs. The set up display. To select thl Use this mode for...
... mode you can control the operations of the unit by inputting a number or letter. PRGM Mode Use this mode for arithmetic calculations and function calculations for drawing graphs and for executing programs. BASE 2616E • To change , and to select the mode you want . Use the cursor ...Displays •Use only the procedures described above to adjust the color contrast of a mode has an effect on the calculation results it produces. oln addition to using the cursor keys to input functions and draw their graphs. The set up display. To select thl Use this mode for...

Owners Manual
Page 30
...) Switches on display of the function when drawing a graph or using single-variable or paired-variable calculation results *Paired-Variable Statistic Calculation (REG) ligastai Ifimircowpm E(LIN) E(LOG) El(EXP) Cl(PWR) EEEE Linear regression Logarithmic regression Exponential regression Power regression •Paired-Variable Statistical Graph Data Input Color (S-plot) E(BLU) FR (ORN) E(GRN) harligartiWI E F2...
...) Switches on display of the function when drawing a graph or using single-variable or paired-variable calculation results *Paired-Variable Statistic Calculation (REG) ligastai Ifimircowpm E(LIN) E(LOG) El(EXP) Cl(PWR) EEEE Linear regression Logarithmic regression Exponential regression Power regression •Paired-Variable Statistical Graph Data Input Color (S-plot) E(BLU) FR (ORN) E(GRN) harligartiWI E F2...
Owners Manual
Page 31
... (OFF) Overwriting of Dynamic Graphs (with newest graph,indicated by color) No overwriting of icon indicates that a function will be accessed (but you can display data in the above the function key. -27- IllAbout Display Colors The calculator can use the following procedure to change the color to orange or green if you... want to display the graph and comment text in the color you specify. Press the function key that appear at the ...
... (OFF) Overwriting of Dynamic Graphs (with newest graph,indicated by color) No overwriting of icon indicates that a function will be accessed (but you can display data in the above the function key. -27- IllAbout Display Colors The calculator can use the following procedure to change the color to orange or green if you... want to display the graph and comment text in the color you specify. Press the function key that appear at the ...

Owners Manual
Page 34
... Key Operation Mg Type B function Sine: Example 2 sin45° Key Operation MOD •For detailed examples on page 56. • To clear an entire calculation and start again Press them key to r, 0 and variables. • To clear statistical memories only cw F2 (SCI) exE -32- •This operation ... need data •You any values assigned to Ex2, Ex, n, Eye, Ey, and Exy. •The above operation clears bar graph memory contents when the S-graph mode is in any mode. • To clear the entire memory cw EimcliEJ This operation clears all of the value memories, as well...
... Key Operation Mg Type B function Sine: Example 2 sin45° Key Operation MOD •For detailed examples on page 56. • To clear an entire calculation and start again Press them key to r, 0 and variables. • To clear statistical memories only cw F2 (SCI) exE -32- •This operation ... need data •You any values assigned to Ex2, Ex, n, Eye, Ey, and Exy. •The above operation clears bar graph memory contents when the S-graph mode is in any mode. • To clear the entire memory cw EimcliEJ This operation clears all of the value memories, as well...

Owners Manual
Page 46
... the.case of the Dynamic GraPh display. 1-8 Technical Information This section provides information on the internal workings of the unit. sinh-1, cosh-I, tanh-I, (-), parenthesis, (following order: C)Coordinate transformation Pol (x, y), Rec (r, 0) Differentials, integrations, E calculations didx, ldx, E -...- ', tan-1, sinh, cosh, tank; execution is pressed. The contents of each type of display are used for calculations and instructions. liCalculation Priority Sequence This calEulator employs true algebraic logic to clear each type of display are different. •...
... the.case of the Dynamic GraPh display. 1-8 Technical Information This section provides information on the internal workings of the unit. sinh-1, cosh-I, tanh-I, (-), parenthesis, (following order: C)Coordinate transformation Pol (x, y), Rec (r, 0) Differentials, integrations, E calculations didx, ldx, E -...- ', tan-1, sinh, cosh, tank; execution is pressed. The contents of each type of display are used for calculations and instructions. liCalculation Priority Sequence This calEulator employs true algebraic logic to clear each type of display are different. •...
Owners Manual
Page 48
...the following procedure to bring the calculator back to switch between 2 different types of the display. E _03 (Norm 1 display format) -+I L-101° - This means that the calculator is busy drawing a graph or executing a long, complex calculation or program, a black box ...(•) flashes in the upper right corner of .exponential display formats. MCalculation Execution Display When the calculator is performing an internal operation. This ...
...the following procedure to bring the calculator back to switch between 2 different types of the display. E _03 (Norm 1 display format) -+I L-101° - This means that the calculator is busy drawing a graph or executing a long, complex calculation or program, a black box ...(•) flashes in the upper right corner of .exponential display formats. MCalculation Execution Display When the calculator is performing an internal operation. This ...

Owners Manual
Page 66
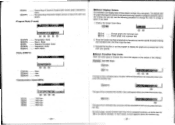
...to store the data. Press the function key below the operation you can be sure to clear memory contents before beginning calculations. 5-1 Single-Variable Statistical Calculations You should use the procedure on the display. sion, exponential regression and power regression.. Next, use the Standard Deviation Mode... 20, 20, 20, 20, 20, 20, 30 10E(DT)20EI(;)61tI(DT)36CI(DT) Not0 that you want to perform statistical operations. S-graPh:NON- E(DT) Inputs data E(CL) Clears data El(;) Used to store values. G-type :REC/CON Ansle :Deg Display:Nrml M-D/CPY:M-DisP ...
...to store the data. Press the function key below the operation you can be sure to clear memory contents before beginning calculations. 5-1 Single-Variable Statistical Calculations You should use the procedure on the display. sion, exponential regression and power regression.. Next, use the Standard Deviation Mode... 20, 20, 20, 20, 20, 20, 30 10E(DT)20EI(;)61tI(DT)36CI(DT) Not0 that you want to perform statistical operations. S-graPh:NON- E(DT) Inputs data E(CL) Clears data El(;) Used to store values. G-type :REC/CON Ansle :Deg Display:Nrml M-D/CPY:M-DisP ...

Owners Manual
Page 67
DID RUN / SD S-data :STO S-graPh:NON- G-type :REC/CON Angle :Deg Display:Nrmi M-D/Cpy:M-DisP IFTWIEMMIRKBP E EE E The following sequence to delete any data item h,as,a negative value, or if ... stored in , their own memory area, and so they do not use value memories. , •See pages 109 and 170 for the formulas used to calculate standard deviation, mean, and probability distribution. •The maximum value is the largest value input for X, while the minimum value is the smallest vakie input...
DID RUN / SD S-data :STO S-graPh:NON- G-type :REC/CON Angle :Deg Display:Nrmi M-D/Cpy:M-DisP IFTWIEMMIRKBP E EE E The following sequence to delete any data item h,as,a negative value, or if ... stored in , their own memory area, and so they do not use value memories. , •See pages 109 and 170 for the formulas used to calculate standard deviation, mean, and probability distribution. •The maximum value is the largest value input for X, while the minimum value is the smallest vakie input...

Owners Manual
Page 68
E(EDIT) CXD X I 2 [ 52 3 ME 4 59 5 55 letIrSOI f I . 2 I 50 E(INS) X f I 2 [ :: I 3 MOE I 0 50 I ] 2 58 After you draw • a single-variable statistic graph (bar graph) on the display (page 171). -1O1- IllPerforming Single-Variable Calculations After inputting the data, selectthe type of operation you finishinserting the data, press inn and the (see page 109). Press one of...
E(EDIT) CXD X I 2 [ 52 3 ME 4 59 5 55 letIrSOI f I . 2 I 50 E(INS) X f I 2 [ :: I 3 MOE I 0 50 I ] 2 58 After you draw • a single-variable statistic graph (bar graph) on the display (page 171). -1O1- IllPerforming Single-Variable Calculations After inputting the data, selectthe type of operation you finishinserting the data, press inn and the (see page 109). Press one of...

Owners Manual
Page 69
... between•x- and y-data . S-plCit. :ORANGE IG-type :REC./CON Angle :Deg •When drawing a graph for the statistical data (S-data). The following are avilable from the function display at the bottom of regression you want... E(O E(R 0 E(r 0 E Probability P (t) value Probability Q (t) value Probability R (t) value Normalized variation t (x) F2 Q E -102- • 5.2 Paired-Variable Statistical Calculations You should use the procedure on page 24 to specify the type of the screen. E(DEV) Statistical menu ', E(E) Sum data menu E(REG) Regressipntestimated value menu...
... between•x- and y-data . S-plCit. :ORANGE IG-type :REC./CON Angle :Deg •When drawing a graph for the statistical data (S-data). The following are avilable from the function display at the bottom of regression you want... E(O E(R 0 E(r 0 E Probability P (t) value Probability Q (t) value Probability R (t) value Normalized variation t (x) F2 Q E -102- • 5.2 Paired-Variable Statistical Calculations You should use the procedure on page 24 to specify the type of the screen. E(DEV) Statistical menu ', E(E) Sum data menu E(REG) Regressipntestimated value menu...

Owners Manual
Page 102
... to specify range parameters with the calculation range highlighted in the graph. At this time, the probability calculation result appears on the display, with probability distribution graphs. Draws standard normal distribution curve and calculates probability P(t) Draws standard normal distribution curve and calculates probability Q(t) Draws standard normal distribution curve and calculates probability R(t) Calculates normalized' variate t(x) •You cannot draw...
... to specify range parameters with the calculation range highlighted in the graph. At this time, the probability calculation result appears on the display, with probability distribution graphs. Draws standard normal distribution curve and calculates probability P(t) Draws standard normal distribution curve and calculates probability Q(t) Draws standard normal distribution curve and calculates probability R(t) Calculates normalized' variate t(x) •You cannot draw...


