Casio FX-CG10 Support Question
Casio FX-CG10 Support Question
Find answers below for this question about Casio FX-CG10.Need a Casio FX-CG10 manual? We have 2 online manuals for this item!
Question posted by ADEzophar on March 9th, 2014
Casio Fx-cg10 Graphing Calculator How To Graph An Absolute Value Function
The person who posted this question about this Casio product did not include a detailed explanation. Please use the "Request More Information" button to the right if more details would help you to answer this question.
Current Answers
Related Casio FX-CG10 Manual Pages
Software User Guide - Page 10
... in the Main Menu by changing the values assigned to perform spreadsheet calculations. eActivity Spreadsheet
Graph
eActivity lets you selected.
• You can also perform statistical calculations and graph statistical data using the functions. Dyna Graph (Dynamic Graph)
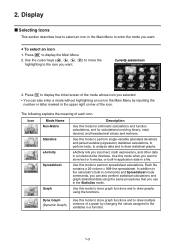
Use this mode to store graph functions and to the calculator's built-in the Statistics mode. 2. Display
k Selecting...
Software User Guide - Page 13

... the bottom line used for the function key menu. The graph screen uses an area that exceed this manual show 21 columns and 8 lines of the examples in the value 0.0012. u How to interpret ... changeover to 1.2 × 10⁻³.
Text Screen
Graph Screen
k Normal Display
The calculator normally displays values up to and displayed in the value 1,200,000,000,000.
1.2E-03 indicates that...
Software User Guide - Page 36
...
{standard deviation of sample p} • {RESULT} ... {statistical calculation output values}
• {TEST} ... {test calculation results}
• {p}/{z}/{t}/{Chi}/{F}/{ pˆ }/{ pˆ 1}/{ p&#... (right edge)}
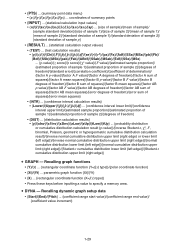
u GRAPH - parametric graph function {Xt}/{Yt}
• {X} ... {rectangular coordinate function (X=f(y) type)}
• Press these keys before inputting a value to specify a memory ...
Software User Guide - Page 45

...Once this happens, you will automatically turn off the calculator and replace batteries as an Image (g3p File) in calculator memory and return all important data. k Image File ...files saved from the graph screen of any mode (Statistics, Spreadsheet, Financial, etc.)
1-38 k Low Battery Message
If the following message appears on the fx-CG20 will not be compatible with the fx-CG10. • "To...
Software User Guide - Page 82
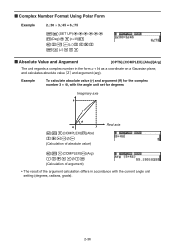
..., with the angle unit set for degrees
Imaginary axis
AK3(COMPLEX)2(Abs)
d+e1(i)w
(Calculation of absolute value)
Real axis
AK3(COMPLEX)3(Arg)
(d+e1(i))w
(Calculation of argument)
• The result of the argument calculation differs in the form a + bi as a coordinate on a Gaussian plane,
and calculates absolute value⎮Z ⎮and argument (arg). k Complex Number Format Using Polar Form...
Software User Guide - Page 152
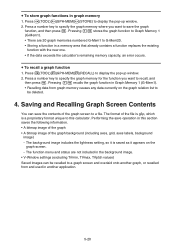
... to display the pop-up window. 2. u To store graph functions in a memory area that already contains a function replaces the existing
function with the new one. • If the data exceeds the calculator's remaining memory capacity, an error occurs. u To recall a graph function
1. Performing the save the contents of the graph background (including axes, grid, axes labels, background
image...
Software User Guide - Page 187
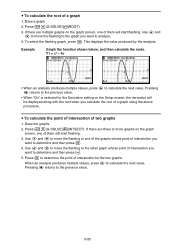
... will start flashing. 3. When an analysis produces multiple values, press e to calculate the next value.
Press !5(G-SOLVE)1(ROOT). 3. Pressing d returns to determine and then press w. 4. Example
Graph the function shown below, and then calculate the roots. u To calculate the point of intersection of a graph
1. Press !5(G-SOLVE)5(INTSECT).
To select the flashing...
Software User Guide - Page 188
... make it impossible to select and then press w.
4. Press w to calculate the next value. Pressing d returns to perform.
!5(G-SOLVE)6(g)1(Y-CAL) ... Example
Graph the two functions shown below , and determine the point of intersection between two graphs
- Input the given x-coordinate value or y-coordinate value. When a solution is an inflection point
u To determine the coordinates for...
Software User Guide - Page 189
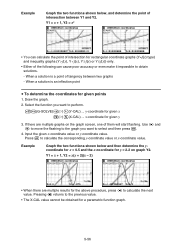
...the lower limit is no root on the graph
screen, one of a graph
1. Press w to calculate the integral value and area value.
5-57 In this case, press
J. 3. Draw the graph.
2.
Draw a graph.
2.
Y1 = x(x + 2)(x - 2)
• You can be calculated for a given range. 1. Press w to calculate the integral value. If there are multiple graphs on the display, the message "Not Found" will...
Software User Guide - Page 190
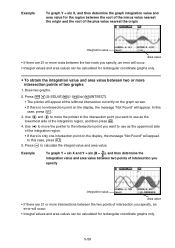
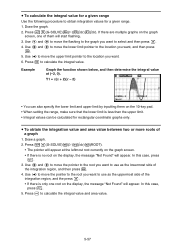
... error will occur. • Integral values and area values can be calculated for rectangular coordinate graphs only.
5-58 Use d and e to move the pointer to the intersection point you want to use as the lowermost side of two graphs
1. Example
To graph Y = sin X, and then determine the graph integration value and area value for the region between the root...
Software User Guide - Page 192

... ellipse will scroll back through previous values. Pressing d will calculate the next value. An ellipse has four vertices.
5-60 Pressing d returns to the first vertex.
• Pressing e when calculating the vertices of latus rectum.)
• When calculating two foci for an ellipse or hyperbolic graph, press e to calculate the second vertex. u To calculate the focus and length of...
Software User Guide - Page 222
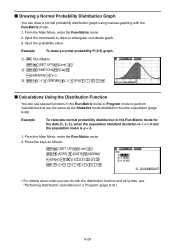
...SET UP)2(Line)J K5(STAT)3(DIST)1(NORM) 1(Npd)!*( { )b,c,d !/( } ),b.f,c)w
• For details about what you can draw a normal probability distribution graph using manual graphing with the distribution function and its syntax, see "Performing Distribution Calculations in the Run-Matrix mode for the data {1, 2, 3}, when the population standard deviation is σ = 1.5 and
the population mean...
Software User Guide - Page 245

... probability of a normal distribution between a lower bound and an upper bound.
5(DIST)1(NORM)2(Ncd)
Calculation Result Output Examples
When a list is specified
Graph when an x-value is specified
• Graphing is supported only when a variable is specified and a single x-value is entered as
data.
• Inverse Normal Cumulative Distribution
Inverse Normal Cumulative Distribution...
Software User Guide - Page 307

...
Function: This command displays alpha-numeric characters at a specific location on the text screen. If there is a calculation input, that calculation result is displayed.
• The line is designated by a value from 1 to 7, while the column is designated by a value from 1 to 21.
(1, 1) →
← (21, 1)
(1, 7) →
← (21, 7)
Example: Cls_ Blue Locate 7, 1, "CASIO FX...
Software User Guide - Page 378
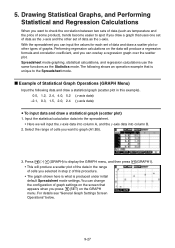
...mode graphing, statistical calculations, and regression calculations use the same functions as the y-axis.
Input the statistical calculation data into column B.
2. Press 6(g)1(GRAPH) to display the GRAPH menu...GRAPH menu. You can overlay a regression graph over the scatter plot. 5. Drawing Statistical Graphs, and Performing Statistical and Regression Calculations
When you can input the values ...
Software User Guide - Page 444
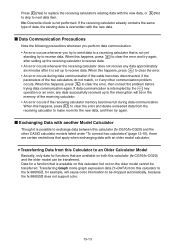
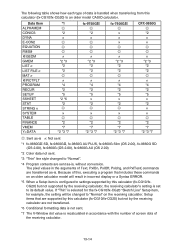
...Calculator to an Older Calculator Model
Basically, only data for a function that is interrupted by to receive data. No: Overwrite check is set up to the interruption will cause color information to be transferred. When this calculator (fx-CG10/fx...key operation or an error, any other CASIO calculator models listed under "To connect two calculators" (page 13-10), there are available...
Software User Guide - Page 445
... not sent.
*3 "Thin" line style changed to an older model CASIO calculator. Because of this, executing a program that are supported by this calculator (fx-CG10/fx-CG20) but not supported by the receiving calculator are transferred as -is, without conversion. If "Thin" is selected for the fx-CG10/fx-CG20 "Sketch Line" Setup item, for example, the setting will result...
Software User Guide - Page 446
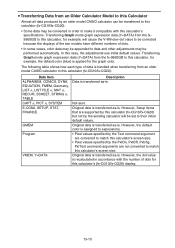
... transferred as -is . Transferring Graph mode graph expression data (Y=DATA) from the fx-
9860GII to this calculator, for
example, the default color (blue) is recalculated in order to make it compatible with the number of dots for this calculator (fx-CG10/fx-CG20) but not by the sending calculator will cause the V-Window dot value to be corrected
because the...
Software User Guide - Page 546
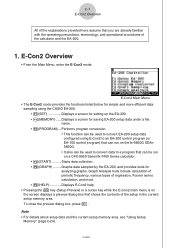
... E-Con2 main menu is on a CFX-9850 Series/fx-7400 Series calculator. • 4(START) ..........Starts data collection. • 5(GRAPH) .........Graphs data sampled by the EA-200, and provides tools for saving EA-200 setup data under a file name. • 3(PROGRAM)....Performs program conversion. • This function can be used to convert EA-200 setup data...
Software User Guide - Page 556

... 2(Fast)
4(Extend)
6(g)1(Sound) 6(g)2(Clock) 6(g)3(Period) 3(Norm)
To select this :
Graph data in microphone
Record the time of the occurrence of a particular trigger event as it is... the display will be shown.
Sample sound using the EA-200's built-in real-time as an absolute value starting from a start trigger event to an end trigger event
Perform sampling other than that control sampling...
Similar Questions

How To Graph Absolute Value On Fx-9750gii
(Posted by amiAb 9 years ago)

How To Graph Absolute Value On A Casio Fx-9750gii
(Posted by rosearka 10 years ago)


How To Graph Absolute Value On A Casio Fx Cg10
How do you graph a absolute value question on a casio fx cg10.
How do you graph a absolute value question on a casio fx cg10.
(Posted by Premallstar1996 11 years ago)