
User Manual
Page 31
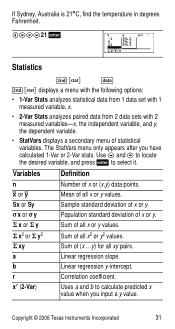
... regression y-intercept. r Correlation coefficient. Sx or Sy Îx or Îy Òx or Òy Sample standard deviation of statistical variables. a Linear regression slope. Copyright © 2006 Texas Instruments Incorporated 31 If Sydney, Australia is 21ÄC, find the temperature in degrees Fahrenheit. !$$$21 < Statistics % t...1-Var or 2-Var stats. Variables Definition n Ï or Ð Number of x or y. Population standard deviation of x or (x,y) data points. xÅ (2-Var) Uses a and b to select it. The StatVars menu only appears after you input a ...
... regression y-intercept. r Correlation coefficient. Sx or Sy Îx or Îy Òx or Òy Sample standard deviation of statistical variables. a Linear regression slope. Copyright © 2006 Texas Instruments Incorporated 31 If Sydney, Australia is 21ÄC, find the temperature in degrees Fahrenheit. !$$$21 < Statistics % t...1-Var or 2-Var stats. Variables Definition n Ï or Ð Number of x or y. Population standard deviation of x or (x,y) data points. xÅ (2-Var) Uses a and b to select it. The StatVars menu only appears after you input a ...
Teachers Guide
Page 79
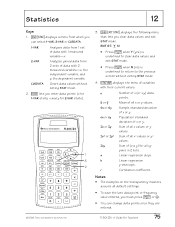
x and y for 1-VAR stats; Population standard deviation of x (or x,y) data points. EXIT ST: Y N • Press < when Y (yes) is underlined to clear data values and exit STAT mode. • Press < when N (no) ...or Gy Gx2 or Gy2 Gxy Sample standard deviation of all x values or y values. Sum of x or y. a Linear regression slope. CLRDATA Clears data values without exiting STAT mode. 4. Statistics 12 Keys 1. % t displays a menu from which you can change data points once they are entered. © 1999 TEXAS INSTRUMENTS INCORPORATED TI-30X ÙS: A Guide For Teachers ...
x and y for 1-VAR stats; Population standard deviation of x (or x,y) data points. EXIT ST: Y N • Press < when Y (yes) is underlined to clear data values and exit STAT mode. • Press < when N (no) ...or Gy Gx2 or Gy2 Gxy Sample standard deviation of all x values or y values. Sum of x or y. a Linear regression slope. CLRDATA Clears data values without exiting STAT mode. 4. Statistics 12 Keys 1. % t displays a menu from which you can change data points once they are entered. © 1999 TEXAS INSTRUMENTS INCORPORATED TI-30X ÙS: A Guide For Teachers ...
Teachers Guide
Page 81
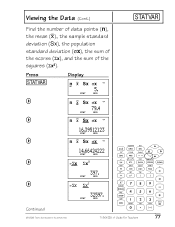
STAT DEG ¸Gx -G-x-2 32597. Sx sx ¹ 79.4 STAT DEG n v -S-x- STAT DEG u Continued © 1999 TEXAS INSTRUMENTS INCORPORATED TI-30X ÙS: A Guide For Teachers 77 sx ¹ 16.39512123 STAT DEG n v Sx -s-x- ¹ 14.66424222 STAT DEG ¸-G-x- Gx2 397. Viewing the Data (Cont.) Find the number of data points (n), the mean (v), the sample standard deviation (Sx), the population standard deviation (sx), the sum of the scores (Gx), and the sum of the squares (Gx2). Press u " " " " " Display n- v Sx sx 5. ¹ STAT DEG n v-
STAT DEG ¸Gx -G-x-2 32597. Sx sx ¹ 79.4 STAT DEG n v -S-x- STAT DEG u Continued © 1999 TEXAS INSTRUMENTS INCORPORATED TI-30X ÙS: A Guide For Teachers 77 sx ¹ 16.39512123 STAT DEG n v Sx -s-x- ¹ 14.66424222 STAT DEG ¸-G-x- Gx2 397. Viewing the Data (Cont.) Find the number of data points (n), the mean (v), the sample standard deviation (Sx), the population standard deviation (sx), the sum of the scores (Gx), and the sum of the squares (Gx2). Press u " " " " " Display n- v Sx sx 5. ¹ STAT DEG n v-
Teachers Guide
Page 110
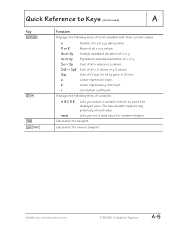
...of stat variables with their current values. b Linear regression y-intercept. Calculates the inverse tangent. © 1999 TEXAS INSTRUMENTS INCORPORATED TI-30X ÙS: A Guide For Teachers A-5 sx or sy Population standard deviation of (x Q y) for random integers. Gxy Sum of x or y. a Linear regression slope. r ...following menu of all x or y values. rand Lets you select a variable in 2 lists. Sx or Sy Sample standard deviation of variables. n v or w Number of x (or x,y) data points. A B C D E Lets you set a seed value for all x values or ...
...of stat variables with their current values. b Linear regression y-intercept. Calculates the inverse tangent. © 1999 TEXAS INSTRUMENTS INCORPORATED TI-30X ÙS: A Guide For Teachers A-5 sx or sy Population standard deviation of (x Q y) for random integers. Gxy Sum of x or y. a Linear regression slope. r ...following menu of all x or y values. rand Lets you select a variable in 2 lists. Sx or Sy Sample standard deviation of variables. n v or w Number of x (or x,y) data points. A B C D E Lets you set a seed value for all x values or ...


