
User Manual
Page 2
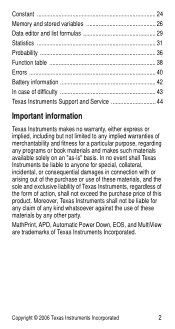
...APD, Automatic Power Down, EOS, and MultiView are trademarks of these materials, and the sole and exclusive liability of Texas Instruments, regardless of the form of action, shall not exceed the purchase price of this product. Moreover, Texas Instruments shall not be liable to any implied ... Data editor and list formulas 29 Statistics 31 Probability 36 Function table 38 Errors 40 Battery information 42 In case of difficulty 43 Texas Instruments Support and Service 44 Important information Texas Instruments makes no event shall Texas Instruments be liable for any claim of ...
...APD, Automatic Power Down, EOS, and MultiView are trademarks of these materials, and the sole and exclusive liability of Texas Instruments, regardless of the form of action, shall not exceed the purchase price of this product. Moreover, Texas Instruments shall not be liable to any implied ... Data editor and list formulas 29 Statistics 31 Probability 36 Function table 38 Errors 40 Battery information 42 In case of difficulty 43 Texas Instruments Support and Service 44 Important information Texas Instruments makes no event shall Texas Instruments be liable for any claim of ...
User Manual
Page 13
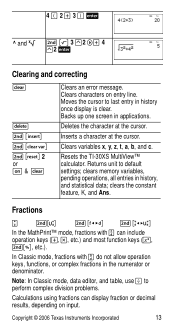
...results, depending on entry line. Resets the TI-30XS MultiView™ calculator. Fractions q %N %j %O In the MathPrint™ mode, fractions with q do not allow operation keys, functions, or complex fractions in history once display is clear. Inserts a character at the cursor. Copyright © 2006 Texas Instruments Incorporated 13 J % f % { ... most function keys (F, %_, etc.). Clears characters on input. Backs up one screen in history, and statistical data; 4 D 2 T 3 E < ^ and xÑ % b 3 G2 "T 4 G2 < Clearing and correcting - Clears an error message.
...results, depending on entry line. Resets the TI-30XS MultiView™ calculator. Fractions q %N %j %O In the MathPrint™ mode, fractions with q do not allow operation keys, functions, or complex fractions in history once display is clear. Inserts a character at the cursor. Copyright © 2006 Texas Instruments Incorporated 13 J % f % { ... most function keys (F, %_, etc.). Clears characters on input. Backs up one screen in history, and statistical data; 4 D 2 T 3 E < ^ and xÑ % b 3 G2 "T 4 G2 < Clearing and correcting - Clears an error message.
User Manual
Page 31
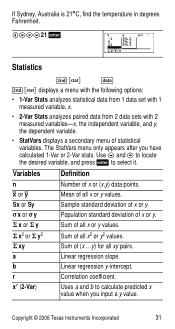
...pairs. b Linear regression y-intercept. a Linear regression slope. Copyright © 2006 Texas Instruments Incorporated 31 If Sydney, Australia is 21ÄC, find the temperature in degrees Fahrenheit. !$$$21 < Statistics % t v % t displays a menu with the following options: • 1-Var Stats analyzes statistical data from 1 data set with 1 measured variable, x. • 2-Var .... xÅ (2-Var) Uses a and b to select it. The StatVars menu only appears after you input a y value. Population standard deviation of statistical variables. r Correlation coefficient.
...pairs. b Linear regression y-intercept. a Linear regression slope. Copyright © 2006 Texas Instruments Incorporated 31 If Sydney, Australia is 21ÄC, find the temperature in degrees Fahrenheit. !$$$21 < Statistics % t v % t displays a menu with the following options: • 1-Var Stats analyzes statistical data from 1 data set with 1 measured variable, x. • 2-Var .... xÅ (2-Var) Uses a and b to select it. The StatVars menu only appears after you input a y value. Population standard deviation of statistical variables. r Correlation coefficient.
User Manual
Page 32
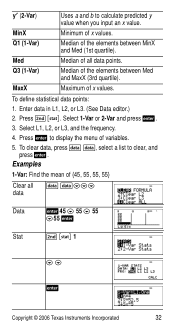
Q3 (1-Var) Median of the elements between MinX and Med (1st quartile). MaxX Maximum of x values. To define statistical data points: 1. MinX Minimum of x values. Press % t. Select 1-Var or 2-Var and press Enter data in L1, L2, or L3. (See Data editor.) 2. yÅ (2-Var) Uses a and b to calculate predicted y value when you input an x value. Q1 (1-Var) Median of all data points. Med Median of the elements between Med and MaxX (3rd quartile).
Q3 (1-Var) Median of the elements between MinX and Med (1st quartile). MaxX Maximum of x values. To define statistical data points: 1. MinX Minimum of x values. Press % t. Select 1-Var or 2-Var and press Enter data in L1, L2, or L3. (See Data editor.) 2. yÅ (2-Var) Uses a and b to calculate predicted y value when you input an x value. Q1 (1-Var) Median of all data points. Med Median of the elements between Med and MaxX (3rd quartile).
User Manual
Page 40
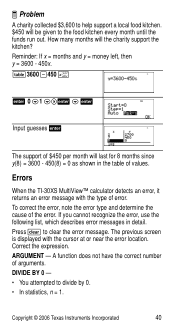
.... to divide by 0. • In statistics, n = 1. Reminder: If x = months and y = money left, then y = 3600 - 450x. Copyright © 2006 Texas Instruments Incorporated 40 A function does not have the correct number of the error. Correct the expression. DIVIDE BY 0 - • You attempted to clear the error message. Errors When the TI-30XS MultiView™ calculator detects an error...
.... to divide by 0. • In statistics, n = 1. Reminder: If x = months and y = money left, then y = 3600 - 450x. Copyright © 2006 Texas Instruments Incorporated 40 A function does not have the correct number of the error. Correct the expression. DIVIDE BY 0 - • You attempted to clear the error message. Errors When the TI-30XS MultiView™ calculator detects an error...
Teachers Guide
Page 4
...Scientific Notation Trig Functions What's My Score - 1-Variable Statistics Heart Rates - 1-Variable Statistics WNBA Stats - 2-Variable Statistics How to Use the TI-30X ÚS 1 TI-30X ÖS Basic Operations 2 Clear, Insert, and Delete 3 Basic Math 4 Order of Contents About the Authors About the Teacher Guide About the TI-30X ÖS Activities The Better Batter - Table of ...D D-1 Support and Service Information 23 Appendix E E-1 Warranty Information 29 33 36 40 43 45 47 52 58 61 68 75 8 1 © 1999 TEXAS INSTRUMENTS INCORPORATED TI-30X ÙS: A Guide for Teachers VI
...Scientific Notation Trig Functions What's My Score - 1-Variable Statistics Heart Rates - 1-Variable Statistics WNBA Stats - 2-Variable Statistics How to Use the TI-30X ÚS 1 TI-30X ÖS Basic Operations 2 Clear, Insert, and Delete 3 Basic Math 4 Order of Contents About the Authors About the Teacher Guide About the TI-30X ÖS Activities The Better Batter - Table of ...D D-1 Support and Service Information 23 Appendix E E-1 Warranty Information 29 33 36 40 43 45 47 52 58 61 68 75 8 1 © 1999 TEXAS INSTRUMENTS INCORPORATED TI-30X ÙS: A Guide for Teachers VI
Teachers Guide
Page 5
Scientific Notation 6 Trig Functions 10 What's My Score? - 1-Variable Statistics 14 Heart Rates - 1-Variable Statistics 17 WNBA Stats - 2-Variable Statistics 23 © 1999 TEXAS INSTRUMENTS INCORPORATED TI-30X ÙS: A Guide for Teachers 1 The FIX Key 2 Star Voyage - Activities The Better Batter -
Scientific Notation 6 Trig Functions 10 What's My Score? - 1-Variable Statistics 14 Heart Rates - 1-Variable Statistics 17 WNBA Stats - 2-Variable Statistics 23 © 1999 TEXAS INSTRUMENTS INCORPORATED TI-30X ÙS: A Guide for Teachers 1 The FIX Key 2 Star Voyage - Activities The Better Batter -
Teachers Guide
Page 18
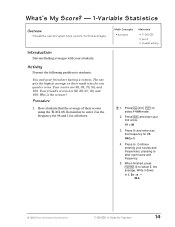
...= 98 3. Write it down. Have students find averages. Press % t < to enter 2 as the frequency for all others. n v Sx sx ¹ 92.6 © 1999 TEXAS INSTRUMENTS INCORPORATED TI-30X ÙS: A Guide for one quarter wins. Your scores are 89, 89, 97, 90, and 100. Math Concepts • averages Materials •... select v, the average. Press v and enter your students. Your friend’s scores are 98, 89, 78, 98, and 100. What's My Score? - 1-Variable Statistics Overview Students use the given test scores to find the average of their math tests for Teachers 14
...= 98 3. Write it down. Have students find averages. Press % t < to enter 2 as the frequency for all others. n v Sx sx ¹ 92.6 © 1999 TEXAS INSTRUMENTS INCORPORATED TI-30X ÙS: A Guide for one quarter wins. Your scores are 89, 89, 97, 90, and 100. Math Concepts • averages Materials •... select v, the average. Press v and enter your students. Your friend’s scores are 98, 89, 78, 98, and 100. What's My Score? - 1-Variable Statistics Overview Students use the given test scores to find the average of their math tests for Teachers 14
Teachers Guide
Page 19
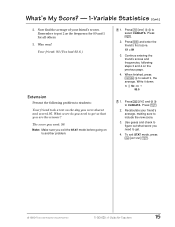
Now find the average of your friend’s scores. The score you need to another problem. ³ 1. Your friend: 93 (You had 92.6.) Extension Present the following problem to students: Your friend took a test on to get so that you were absent and scored 95. What's My Score? - 1-Variable Statistics (Cont.) 2. Remember to select CLRDATA. What score do you need : 98 Note: Make sure you exit the STAT mode before going on the day you are the winner? Press % t " " to put 2 as the frequency for 89 and 1 for all others. 3. Press Who won?
Now find the average of your friend’s scores. The score you need to another problem. ³ 1. Your friend: 93 (You had 92.6.) Extension Present the following problem to students: Your friend took a test on to get so that you were absent and scored 95. What's My Score? - 1-Variable Statistics (Cont.) 2. Remember to select CLRDATA. What score do you need : 98 Note: Make sure you exit the STAT mode before going on the day you are the winner? Press % t " " to put 2 as the frequency for 89 and 1 for all others. 3. Press Who won?
Teachers Guide
Page 20
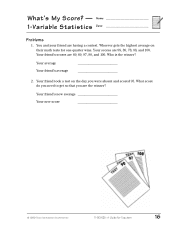
... took a test on their math tests for Teachers 16 Name 1-Variable Statistics Date Problems 1. What score do you need to get so that you were absent and scored 95. Your friend’s new average Your new score © 1999 TEXAS INSTRUMENTS INCORPORATED TI-30X ÙS: A Guide for one quarter wins. Whoever gets the highest average...
... took a test on their math tests for Teachers 16 Name 1-Variable Statistics Date Problems 1. What score do you need to get so that you were absent and scored 95. Your friend’s new average Your new score © 1999 TEXAS INSTRUMENTS INCORPORATED TI-30X ÙS: A Guide for one quarter wins. Whoever gets the highest average...
Teachers Guide
Page 21
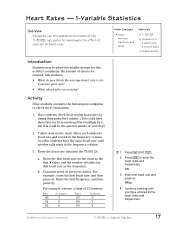
..., and then press $. As other students have them time for 10 seconds and then multiply by timing their estimations. 1. Heart Rates - 1-Variable Statistics Overview Students use the statistics functions of the TI-30XÙS calculator to investigate the effect of 22 students: Rate Students Rate Students 60 3 63 3 61 5 64 1 62 6 65 4 Math Concepts...
..., and then press $. As other students have them time for 10 seconds and then multiply by timing their estimations. 1. Heart Rates - 1-Variable Statistics Overview Students use the statistics functions of the TI-30XÙS calculator to investigate the effect of 22 students: Rate Students Rate Students 60 3 63 3 61 5 64 1 62 6 65 4 Math Concepts...

Teachers Guide
Page 22
... were there in great shape. Compare to make a histogram of the 3 sets of group and the heart rate readings. © 1999 TEXAS INSTRUMENTS INCORPORATED TI-30X ÙS: A Guide for 1 minute. Your students' results will see the average heart rate. Now we will vary depending on heart rate... rate after jumping jacks is higher than you expected? 5. Note: The numbers show the results of student sampled. 2. Heart Rates - 1-Variable Statistics (Continued) 4. c. Now have the students do jumping jacks for 1 minute again and record as before . If the class (or individual)...
... were there in great shape. Compare to make a histogram of the 3 sets of group and the heart rate readings. © 1999 TEXAS INSTRUMENTS INCORPORATED TI-30X ÙS: A Guide for 1 minute. Your students' results will see the average heart rate. Now we will vary depending on heart rate... rate after jumping jacks is higher than you expected? 5. Note: The numbers show the results of student sampled. 2. Heart Rates - 1-Variable Statistics (Continued) 4. c. Now have the students do jumping jacks for 1 minute again and record as before . If the class (or individual)...
Teachers Guide
Page 23
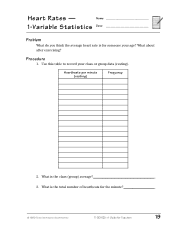
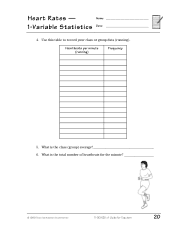
Procedure 1. Heartbeats per minute (resting) Frequency 2. What about after exercising? What is the total number of heartbeats for the minute © 1999 TEXAS INSTRUMENTS INCORPORATED TI-30X ÙS: A Guide for someone your class or group data (resting). Name 1-Variable Statistics Date Problem What do you think the average heart rate is for Teachers 19 Use this table to record your age? What is the class (group) average 3. Heart Rates -
Procedure 1. Heartbeats per minute (resting) Frequency 2. What about after exercising? What is the total number of heartbeats for the minute © 1999 TEXAS INSTRUMENTS INCORPORATED TI-30X ÙS: A Guide for someone your class or group data (resting). Name 1-Variable Statistics Date Problem What do you think the average heart rate is for Teachers 19 Use this table to record your age? What is the class (group) average 3. Heart Rates -
Teachers Guide
Page 24
Heartbeats per minute (running ). What is the total number of heartbeats for the minute © 1999 TEXAS INSTRUMENTS INCORPORATED TI-30X ÙS: A Guide for Teachers 20 Use this table to record your class or group data (running ) Frequency 5. What is the class (group) average 6. Name 1-Variable Statistics Date 4. Heart Rates -
Heartbeats per minute (running ). What is the total number of heartbeats for the minute © 1999 TEXAS INSTRUMENTS INCORPORATED TI-30X ÙS: A Guide for Teachers 20 Use this table to record your class or group data (running ) Frequency 5. What is the class (group) average 6. Name 1-Variable Statistics Date 4. Heart Rates -

Teachers Guide
Page 25
Use this table to record your class or group data (jumping). What is higher than 90, then you are in poor shape. © 1999 TEXAS INSTRUMENTS INCORPORATED TI-30X ÙS: A Guide for the minute 10. Heartbeats per minute (jumping) Frequency 8. If it is the total number of heartbeats for Teachers 21 Name 1-Variable Statistics Date 7. What is less than 125, then you are in great shape. How fit is the class Note: If the class (or individual) heart rate after jumping jacks is the class (group) average 9. Heart Rates -
Use this table to record your class or group data (jumping). What is higher than 90, then you are in poor shape. © 1999 TEXAS INSTRUMENTS INCORPORATED TI-30X ÙS: A Guide for the minute 10. Heartbeats per minute (jumping) Frequency 8. If it is the total number of heartbeats for Teachers 21 Name 1-Variable Statistics Date 7. What is less than 125, then you are in great shape. How fit is the class Note: If the class (or individual) heart rate after jumping jacks is the class (group) average 9. Heart Rates -
Teachers Guide
Page 26
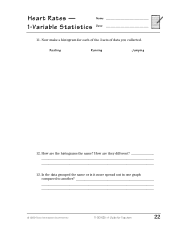
Heart Rates - Is the data grouped the same or is it more spread out in one graph compared to another © 1999 TEXAS INSTRUMENTS INCORPORATED TI-30X ÙS: A Guide for each of the 3 sets of data you collected. Now make a histogram for Teachers 22 Resting Running Jumping 12. How are they different 13. Name 1-Variable Statistics Date 11. How are the histograms the same?
Heart Rates - Is the data grouped the same or is it more spread out in one graph compared to another © 1999 TEXAS INSTRUMENTS INCORPORATED TI-30X ÙS: A Guide for each of the 3 sets of data you collected. Now make a histogram for Teachers 22 Resting Running Jumping 12. How are they different 13. Name 1-Variable Statistics Date 11. How are the histograms the same?
Teachers Guide
Page 27
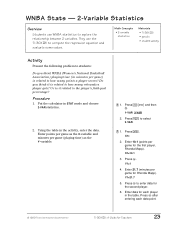
...regression equation and evaluate some values. Enter points per game as the Y-variable. 1. Enter data for each data point. © 1999 TEXAS INSTRUMENTS INCORPORATED TI-30X ÙS: A Guide for the first player, Rhonda Mapp). Press % t and then ". 1-VAR 2-VAR 2. Y1=1 4. Press $ after ... Enter 10.1 (points per game) is related to the player’s field-goal percentage? Math Concepts • 2-variable statistics Materials • TI-30X ÙS • pencils • student activity Activity Present the following problem to how many rebounds a player gets? Put...
...regression equation and evaluate some values. Enter points per game as the Y-variable. 1. Enter data for each data point. © 1999 TEXAS INSTRUMENTS INCORPORATED TI-30X ÙS: A Guide for the first player, Rhonda Mapp). Press % t and then ". 1-VAR 2-VAR 2. Y1=1 4. Press $ after ... Enter 10.1 (points per game) is related to the player’s field-goal percentage? Math Concepts • 2-variable statistics Materials • TI-30X ÙS • pencils • student activity Activity Present the following problem to how many rebounds a player gets? Put...
Teachers Guide
Page 28
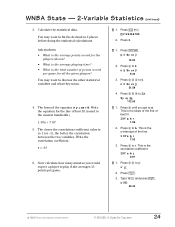
... " to Ð. Press " " " to Ï. Sy Îy Òx 112.00 1. Press " to the nearest hundredth). 1.56x + 7.02 5. Calculate the statistical data. Write the equation for the line of best fit. ÒXY a b r 1.56 2. Press % ,. F0123456789 2. n Ï Sx Îx Ð 9.33 3.... n Ï Sx Îx Ð 21.59 4. This is to 2 places before doing the statistical calculations. You may want to fix the decimal to 1 (or –1), the better the correlation between the two variables. r = .91 6. Press " " " to...
... " to Ð. Press " " " to Ï. Sy Îy Òx 112.00 1. Press " to the nearest hundredth). 1.56x + 7.02 5. Calculate the statistical data. Write the equation for the line of best fit. ÒXY a b r 1.56 2. Press % ,. F0123456789 2. n Ï Sx Îx Ð 9.33 3.... n Ï Sx Îx Ð 21.59 4. This is to 2 places before doing the statistical calculations. You may want to fix the decimal to 1 (or –1), the better the correlation between the two variables. r = .91 6. Press " " " to...
Teachers Guide
Page 29
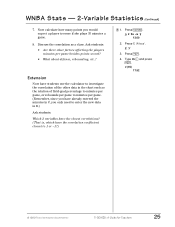
... minutes per game besides points scored? • What about defense, rebounding, etc.? n Ï Sx Îx Ð 12.00 2. Press x¢ y¢ 3. Press u. WNBA Stats - 2-Variable Statistics (Continued) 7. Now calculate how many points you only need to enter the new data in the chart such as a class.
... minutes per game besides points scored? • What about defense, rebounding, etc.? n Ï Sx Îx Ð 12.00 2. Press x¢ y¢ 3. Press u. WNBA Stats - 2-Variable Statistics (Continued) 7. Now calculate how many points you only need to enter the new data in the chart such as a class.

Teachers Guide
Page 30
...1.9 Minutes per game as the X-variable and the minutes per Game 21.7 31.6 21.9 35 33.6 28 16.7 13.2 29.2 8.1 13.6 6.5 © 1999 TEXAS INSTRUMENTS INCORPORATED TI-30X ÙS: A Guide for Teachers 26 Do you think it related to how many rebounds a player gets? Janeth Arcain 4. Malgozata Dydek 7. Or is it is related...points a player scores? Rhonda Mapp 2. Heidi Burge 8. Vicky Bullet 3. Toni Foster 12. Player 1. WNBA Stats - 2-Variable Statistics Name Date Problem Do you think WNBA playing time (in minutes per game) is related to the player’s field goal percentage?...
...1.9 Minutes per game as the X-variable and the minutes per Game 21.7 31.6 21.9 35 33.6 28 16.7 13.2 29.2 8.1 13.6 6.5 © 1999 TEXAS INSTRUMENTS INCORPORATED TI-30X ÙS: A Guide for Teachers 26 Do you think it related to how many rebounds a player gets? Janeth Arcain 4. Malgozata Dydek 7. Or is it is related...points a player scores? Rhonda Mapp 2. Heidi Burge 8. Vicky Bullet 3. Toni Foster 12. Player 1. WNBA Stats - 2-Variable Statistics Name Date Problem Do you think WNBA playing time (in minutes per game) is related to the player’s field goal percentage?...


