Quick Reference Guide
Page 2
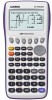
... fx-9"7Th5e0BGasIicIs" CASIO fx-9750GII The following explains the meaning of a graph by changing the values in a function. This icon menu is used to transfer memory contents or back-up data to another unit or PC. DYNAMIC GRAPH TABLE RECURSION CONICS EQUATION PROGRAM This icon menu is used to draw graphs....the program area and to run programs. TIME VALUE OF MONEY Data Analyzer Link LINK This icon menu is used to perform financial calculations and to manage other types of functions. SYSTEM This icon menu is used to initialize memory, adjust contrast, reset memory, and...
... fx-9"7Th5e0BGasIicIs" CASIO fx-9750GII The following explains the meaning of a graph by changing the values in a function. This icon menu is used to transfer memory contents or back-up data to another unit or PC. DYNAMIC GRAPH TABLE RECURSION CONICS EQUATION PROGRAM This icon menu is used to draw graphs....the program area and to run programs. TIME VALUE OF MONEY Data Analyzer Link LINK This icon menu is used to perform financial calculations and to manage other types of functions. SYSTEM This icon menu is used to initialize memory, adjust contrast, reset memory, and...
Quick Reference Guide
Page 6
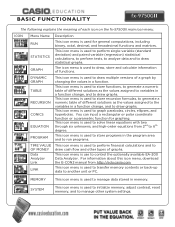
... the window manually by selecting ein the graph window. e(integral): Determine the integral value at (0,3) for the function Y1 2x2 5x 3 . e(Minimum): Note: As long as the x-value of y when x is 5 ? 6. q(y-calculation): What is the value of your vertex is 1? 7. Casio "The Basics fx-9750GII" 6 w(x-calculation): What is the value (s) of x when...
... the window manually by selecting ein the graph window. e(integral): Determine the integral value at (0,3) for the function Y1 2x2 5x 3 . e(Minimum): Note: As long as the x-value of y when x is 5 ? 6. q(y-calculation): What is the value of your vertex is 1? 7. Casio "The Basics fx-9750GII" 6 w(x-calculation): What is the value (s) of x when...

Quick Reference Guide
Page 9
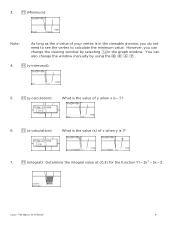
... This section is a scatter-plot. Casio "The Basics fx-9750GII" 9 To input a list of the STAT icon; The initial default graph is an overview of single-variable data, highlight the first cell under List 1 and enter each number followed by l. 1. To change the type of graph you would like to use, press ... exponential, power, sinusoidal and logistic). 3. it and presslor press2. For this example, input this set of statistical data and performs numerous statistical calculations. The initial List Editor Screen that allows input of data: 1, 0.5, 1.2, 4, -1, 1, 3, 5, 6, 3.4 2.
... This section is a scatter-plot. Casio "The Basics fx-9750GII" 9 To input a list of the STAT icon; The initial default graph is an overview of single-variable data, highlight the first cell under List 1 and enter each number followed by l. 1. To change the type of graph you would like to use, press ... exponential, power, sinusoidal and logistic). 3. it and presslor press2. For this example, input this set of statistical data and performs numerous statistical calculations. The initial List Editor Screen that allows input of data: 1, 0.5, 1.2, 4, -1, 1, 3, 5, 6, 3.4 2.
Quick Reference Guide
Page 10
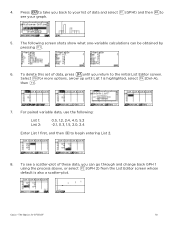
For paired variable data, use the following screen shots show what one-variable calculations can go through and change back GPH 1 using the process above, or select w(GPH 2) from the List Editor screen whose default is highlighted, select r(Del-A), ... of data, press duntil you can be obtained by pressing q. 6. Select ufor more options, arrow up until List 1 is also a scatter-plot. To see your graph. 5. To delete this set of these data, you return to the initial List Editor screen. Casio "The Basics fx-9750GII" 10 4.
For paired variable data, use the following screen shots show what one-variable calculations can go through and change back GPH 1 using the process above, or select w(GPH 2) from the List Editor screen whose default is highlighted, select r(Del-A), ... of data, press duntil you can be obtained by pressing q. 6. Select ufor more options, arrow up until List 1 is also a scatter-plot. To see your graph. 5. To delete this set of these data, you return to the initial List Editor screen. Casio "The Basics fx-9750GII" 10 4.
Quick Reference Guide
Page 11
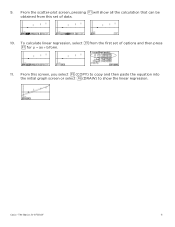
From the scatter-plot screen, pressing qwill show all the calculation that can be obtained from this screen, you select y(COPY) to copy and then paste the equation into the initial graph screen or select u(DRAW) to show the linear regression. From this set of data. 10. Casio "The Basics fx-9750GII" 11 9. To calculate linear regression, select wfrom the first set of options and then press qfor y ax b form. 11.
From the scatter-plot screen, pressing qwill show all the calculation that can be obtained from this screen, you select y(COPY) to copy and then paste the equation into the initial graph screen or select u(DRAW) to show the linear regression. From this set of data. 10. Casio "The Basics fx-9750GII" 11 9. To calculate linear regression, select wfrom the first set of options and then press qfor y ax b form. 11.


