
Quick Reference Guide
Page 1
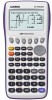
... more on-screen choices. The pkey displays every mode the calculator has. The z key is used to perform general computations and arithmetic. QUICK REFERENCE CARD "The BaCsAicSsI"OfRxfex-f-e99r77e5n50ce0SeCGraiIerIds Selecting the RUN icon will allow you to obtain a fraction bar. The function keys allow you to access the tab (soft key) menus that will change answers or entered numbers back and fourth from decimal to fraction form. When an...
... more on-screen choices. The pkey displays every mode the calculator has. The z key is used to perform general computations and arithmetic. QUICK REFERENCE CARD "The BaCsAicSsI"OfRxfex-f-e99r77e5n50ce0SeCGraiIerIds Selecting the RUN icon will allow you to obtain a fraction bar. The function keys allow you to access the tab (soft key) menus that will change answers or entered numbers back and fourth from decimal to fraction form. When an...
Quick Reference Guide
Page 2
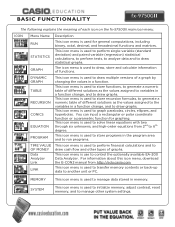
...-order equations from http://edu.casio.com. This icon menu is used to draw multiple versions of each icon on the fx-9750GII main icon menu. MEMORY This icon menu is use to manage data stored in a function change , and to generate a numeric table of graphs. You can input a rectangular or polar coordinate function or a parametric function for general computations, including binary, octal, decimal, and hexadecimal functions and matrices. This icon menu is used to 6th degree. The icon menu is used to draw, store...
...-order equations from http://edu.casio.com. This icon menu is used to draw multiple versions of each icon on the fx-9750GII main icon menu. MEMORY This icon menu is use to manage data stored in a function change , and to generate a numeric table of graphs. You can input a rectangular or polar coordinate function or a parametric function for general computations, including binary, octal, decimal, and hexadecimal functions and matrices. This icon menu is used to 6th degree. The icon menu is used to draw, store...
Quick Reference Guide
Page 3
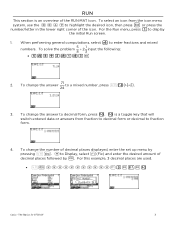
... screen. 1. When performing general computations, select z to a mixed number, press LxX. 24 3. x is an overview of decimal places followed by pressing Lp. To change the number of the icon. To change the answer to fraction form. 4. To select an icon from fraction to decimal form or decimal to decimal form, press x. To solve the problem 5 2 1 input the following: 83 5z8+2z1z3l 2. For this example, 3 decimal places are used. LpNNNNNNNNNNNq3ldlx Casio "The Basics fx-9750GII...
... screen. 1. When performing general computations, select z to a mixed number, press LxX. 24 3. x is an overview of decimal places followed by pressing Lp. To change the number of the icon. To change the answer to fraction form. 4. To select an icon from fraction to decimal form or decimal to decimal form, press x. To solve the problem 5 2 1 input the following: 83 5z8+2z1z3l 2. For this example, 3 decimal places are used. LpNNNNNNNNNNNq3ldlx Casio "The Basics fx-9750GII...
Quick Reference Guide
Page 4
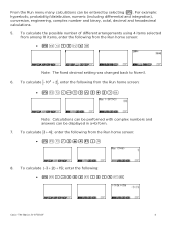
... from the Run home screen: iue10w4l Note: The fixed decimal setting was changed back to Norm1. 6. enter the following from the Run home screen: iewj3+4qkl 8. enter the following : iejn3+2qk+15ql Casio "The Basics fx-9750GII" 4 From the Run menu many calculations can be entered by selecting i. For example: hyperbolic, probability/distribution, numeric (including differential and integration), conversion, engineering, complex number and binary, octal, decimal and hexadecimal calculations. 5.
... from the Run home screen: iue10w4l Note: The fixed decimal setting was changed back to Norm1. 6. enter the following from the Run home screen: iewj3+4qkl 8. enter the following : iejn3+2qk+15ql Casio "The Basics fx-9750GII" 4 From the Run menu many calculations can be entered by selecting i. For example: hyperbolic, probability/distribution, numeric (including differential and integration), conversion, engineering, complex number and binary, octal, decimal and hexadecimal calculations. 5.
Quick Reference Guide
Page 5
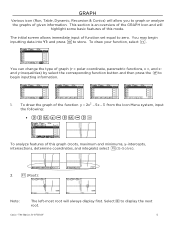
... begin inputting data into Y1: and press lto store. This section is an overview of the GRAPH Icon and will always display first. The initial screen allows immediate input of function set equal to graph or analyze the graphs of this mode. You can change the type of this graph (roots, maximum and minimums, y-intercepts, intersections, determine coordinates, and integrals) select y(G-Solve). 2. To draw the graph of the function y ...
... begin inputting data into Y1: and press lto store. This section is an overview of the GRAPH Icon and will always display first. The initial screen allows immediate input of function set equal to graph or analyze the graphs of this mode. You can change the type of this graph (roots, maximum and minimums, y-intercepts, intersections, determine coordinates, and integrals) select y(G-Solve). 2. To draw the graph of the function y ...
Quick Reference Guide
Page 6
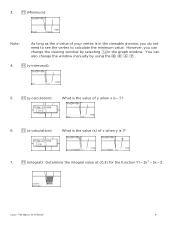
...; 2x2 5x 3 . you can also change the viewing window by using the!$BN. 4. r(y-intercept): 5. You can change the window manually by selecting ein the graph window. However, you do not need to see the vertex to calculate the minimum value. q(y-calculation): What is the value of x when y is 1? 7. 3. Casio "The Basics fx-9750GII" 6 w(x-calculation): What is the value (s) of y when x is in the viewable domain...
...; 2x2 5x 3 . you can also change the viewing window by using the!$BN. 4. r(y-intercept): 5. You can change the window manually by selecting ein the graph window. However, you do not need to see the vertex to calculate the minimum value. q(y-calculation): What is the value of x when y is 1? 7. 3. Casio "The Basics fx-9750GII" 6 w(x-calculation): What is the value (s) of y when x is in the viewable domain...
Quick Reference Guide
Page 7
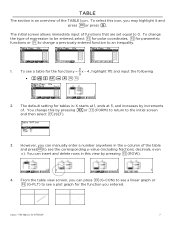
... wfor polar coordinates, efor parametric functions or rto change this by pressing dor q(FORM) to return to 0. However, you can manually enter a number anywhere in this icon, you entered. TABLE The section is : X starts at 1, ends at 5, and increases by pressing e(ROW). 4. To see the corresponding y-value (including fractions, decimals, even ). Casio "The Basics fx-9750GII" 7 The initial screen allows immediate input of the table and presslto see a table for the function...
... wfor polar coordinates, efor parametric functions or rto change this by pressing dor q(FORM) to return to 0. However, you can manually enter a number anywhere in this icon, you entered. TABLE The section is : X starts at 1, ends at 5, and increases by pressing e(ROW). 4. To see the corresponding y-value (including fractions, decimals, even ). Casio "The Basics fx-9750GII" 7 The initial screen allows immediate input of the table and presslto see a table for the function...
Quick Reference Guide
Page 8
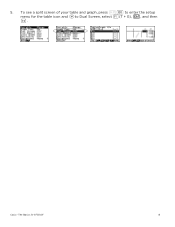
Casio "The Basics fx-9750GII" 8 5. To see a split screen of your table and graph, press Lp to enter the setup menu for the table icon and Nto Dual Screen, select q(T + G), d, and then u.
Casio "The Basics fx-9750GII" 8 5. To see a split screen of your table and graph, press Lp to enter the setup menu for the table icon and Nto Dual Screen, select q(T + G), d, and then u.

Quick Reference Guide
Page 9
To change the type of graph you single or paired-variable data (scatter-plot, line, normal probability, histogram, median box, mean box, normal distribution, broken line, and regression: linear, quadratic, cubic, quartic, logarithmic, exponential, power, sinusoidal and logistic). 3. Casio "The Basics fx-9750GII" 9 From this screen you display various graphs depending on whether you would like to use, press q(GRPH), then u(SET), Nto Graph Type:, for single-variable data and paired-variable data. The initial default graph is an overview of statistical data and performs ...
To change the type of graph you single or paired-variable data (scatter-plot, line, normal probability, histogram, median box, mean box, normal distribution, broken line, and regression: linear, quadratic, cubic, quartic, logarithmic, exponential, power, sinusoidal and logistic). 3. Casio "The Basics fx-9750GII" 9 From this screen you display various graphs depending on whether you would like to use, press q(GRPH), then u(SET), Nto Graph Type:, for single-variable data and paired-variable data. The initial default graph is an overview of statistical data and performs ...
Quick Reference Guide
Page 10
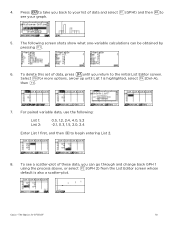
... your graph. 5. Casio "The Basics fx-9750GII" 10 To see your list of data and select q(GPH1) and then lto see a scatter-plot of data, press duntil you can be obtained by pressing q. 6. 4. The following : List 1: List 2: 0.5, 1.2, 2.4, 4.0, 5.2 -2.1, 0.3, 1.5, 2.0, 2.4 Enter List 1 first, and then $to the initial List Editor screen. To delete this set of these data, you return to begin entering List 2. 8. For paired variable data, use the following screen shots show what one-variable calculations can...
... your graph. 5. Casio "The Basics fx-9750GII" 10 To see your list of data and select q(GPH1) and then lto see a scatter-plot of data, press duntil you can be obtained by pressing q. 6. 4. The following : List 1: List 2: 0.5, 1.2, 2.4, 4.0, 5.2 -2.1, 0.3, 1.5, 2.0, 2.4 Enter List 1 first, and then $to the initial List Editor screen. To delete this set of these data, you return to begin entering List 2. 8. For paired variable data, use the following screen shots show what one-variable calculations can...
Quick Reference Guide
Page 11
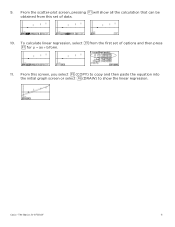
From this screen, you select y(COPY) to copy and then paste the equation into the initial graph screen or select u(DRAW) to show all the calculation that can be obtained from this set of data. 10. To calculate linear regression, select wfrom the first set of options and then press qfor y ax b form. 11. Casio "The Basics fx-9750GII" 11 9. From the scatter-plot screen, pressing qwill show the linear regression.
From this screen, you select y(COPY) to copy and then paste the equation into the initial graph screen or select u(DRAW) to show all the calculation that can be obtained from this set of data. 10. To calculate linear regression, select wfrom the first set of options and then press qfor y ax b form. 11. Casio "The Basics fx-9750GII" 11 9. From the scatter-plot screen, pressing qwill show the linear regression.
Quick Reference Guide
Page 12
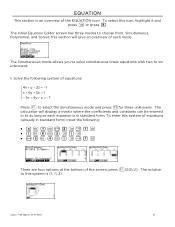
... Simultaneous mode allows you to solve simultaneous linear equations with two to choose from, Simultaneous, Polynomial, and Solver; To enter this section will display a matrix where the coefficients and constants can be entered in to this icon, highlight it and press l or press 8. The calculator will give an overview of the screen, press q(SOLV). this system of equations (already in standard form. Casio "The Basics fx-9750G 12...
... Simultaneous mode allows you to solve simultaneous linear equations with two to choose from, Simultaneous, Polynomial, and Solver; To enter this section will display a matrix where the coefficients and constants can be entered in to this icon, highlight it and press l or press 8. The calculator will give an overview of the screen, press q(SOLV). this system of equations (already in standard form. Casio "The Basics fx-9750G 12...

Quick Reference Guide
Page 13
...) and change the display to a+bi form, press Lp for the Polynomial Set-Up menu, select w(a+bi), d, and then q(SOLV). The third function, Solver e, allows you to determine the value of the numbers in standard form) from the Equation Editor Screen: e2jf-5kL.n3f+2lu Casio "The Basics fx-9750GII" 13 Press dto return to the previous screen, press q(REPT) to the 6th degree. 2. Press duntil the Equation Editor screen is...
...) and change the display to a+bi form, press Lp for the Polynomial Set-Up menu, select w(a+bi), d, and then q(SOLV). The third function, Solver e, allows you to determine the value of the numbers in standard form) from the Equation Editor Screen: e2jf-5kL.n3f+2lu Casio "The Basics fx-9750GII" 13 Press dto return to the previous screen, press q(REPT) to the 6th degree. 2. Press duntil the Equation Editor screen is...

Quick Reference Guide
Page 14
solve the previous equation or begin a new problem. this is 3705.97 cm3. Find the radius (to the previous screen where you can also enter a formula, assign values and solve for specific variable using the solution; Casio "The Basics fx-9750GII 14 You can edit and re- To enter the formula V 4 r3 input the following in to the calculator: 3 qBa2L.4z3Lca6^3l Note: Selecting q will take you back to...
solve the previous equation or begin a new problem. this is 3705.97 cm3. Find the radius (to the previous screen where you can also enter a formula, assign values and solve for specific variable using the solution; Casio "The Basics fx-9750GII 14 You can edit and re- To enter the formula V 4 r3 input the following in to the calculator: 3 qBa2L.4z3Lca6^3l Note: Selecting q will take you back to...

Quick Reference Guide
Page 15
... y(G-Solv), although you would like in accordance with the type of symmetry will still be displayed. Casio "The Basics fx-9750GII" 15 For example, you can continue to analyze different areas of this icon, you may use the BNto select the equation of the function in the graphing section, notice how the vocabulary and options have chosen the conic function that line will need...
... y(G-Solv), although you would like in accordance with the type of symmetry will still be displayed. Casio "The Basics fx-9750GII" 15 For example, you can continue to analyze different areas of this icon, you may use the BNto select the equation of the function in the graphing section, notice how the vocabulary and options have chosen the conic function that line will need...


