
Quick Reference Guide
Page 1
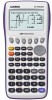
The d key operates like the back arrow on . The d key will not take you back one screen each time you to perform general computations and arithmetic. The pkey displays every mode the calculator has. The O key will power the unit on a web browser; When data is entered, the l button must be pressed to the icon menu. The l key executes operations. it will take you to store the data. To obtain a mixed number, press z after inputting the whole number. The function keys allow you select it. To select a mode, you to the desired icon and press l or press the number or letter...
The d key operates like the back arrow on . The d key will not take you back one screen each time you to perform general computations and arithmetic. The pkey displays every mode the calculator has. The O key will power the unit on a web browser; When data is entered, the l button must be pressed to the icon menu. The l key executes operations. it will take you to store the data. To obtain a mixed number, press z after inputting the whole number. The function keys allow you select it. To select a mode, you to the desired icon and press l or press the number or letter...
Quick Reference Guide
Page 2
... icon menu is use to draw, store and calculate information of each icon on the fx-9750GII main icon menu. This icon menu is used to solve linear equations with two through six unknowns, and high-order equations from http://edu.casio.com. BASIC FUNCTIONALITY fx-9"7Th5e0BGasIicIs" CASIO fx-9750GII The following explains the meaning of functions.
... icon menu is use to draw, store and calculate information of each icon on the fx-9750GII main icon menu. This icon menu is used to solve linear equations with two through six unknowns, and high-order equations from http://edu.casio.com. BASIC FUNCTIONALITY fx-9"7Th5e0BGasIicIs" CASIO fx-9750GII The following explains the meaning of functions.
Quick Reference Guide
Page 3
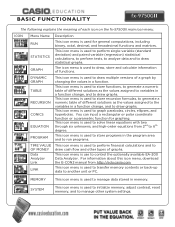
For the Run menu, press 1to display the initial Run screen. 1. For this example, 3 decimal places are used. LpNNNNNNNNNNNq3ldlx Casio "The Basics fx-9750GII" 3 To solve the problem 5 2 1 input the following: 83 5z8+2z1z3l 2. To change the number of decimal places followed by pressing Lp. When performing ...
For the Run menu, press 1to display the initial Run screen. 1. For this example, 3 decimal places are used. LpNNNNNNNNNNNq3ldlx Casio "The Basics fx-9750GII" 3 To solve the problem 5 2 1 input the following: 83 5z8+2z1z3l 2. To change the number of decimal places followed by pressing Lp. When performing ...
Quick Reference Guide
Page 4
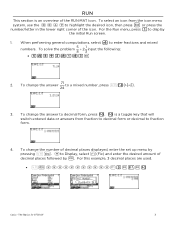
... to Norm1. 6. enter the following from the Run home screen: iewj3+4qkl 8. To calculate 103 2 , enter the following : iejn3+2qk+15ql Casio "The Basics fx-9750GII" 4 For example: hyperbolic, probability/distribution, numeric (including differential and integration), conversion, engineering, complex number and binary, octal, decimal and hexadecimal calculations. 5.
... to Norm1. 6. enter the following from the Run home screen: iewj3+4qkl 8. To calculate 103 2 , enter the following : iejn3+2qk+15ql Casio "The Basics fx-9750GII" 4 For example: hyperbolic, probability/distribution, numeric (including differential and integration), conversion, engineering, complex number and binary, octal, decimal and hexadecimal calculations. 5.
Quick Reference Guide
Page 5
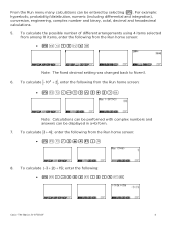
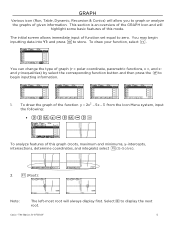
This section is an overview of the GRAPH Icon and will always display first. To draw your function, select u. Casio "The Basics fx-9750GII" 5 Select$to begin inputting data into Y1: and press lto store. and y-inequalities) by select the corresponding function button and then press the $to display ...
This section is an overview of the GRAPH Icon and will always display first. To draw your function, select u. Casio "The Basics fx-9750GII" 5 Select$to begin inputting data into Y1: and press lto store. and y-inequalities) by select the corresponding function button and then press the $to display ...
Quick Reference Guide
Page 6
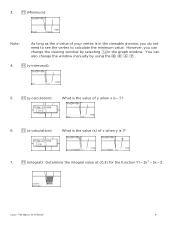
...): What is the value of x when y is in the viewable domain; 3. However, you do not need to see the vertex to calculate the minimum value. Casio "The Basics fx-9750GII" 6
...): What is the value of x when y is in the viewable domain; 3. However, you do not need to see the vertex to calculate the minimum value. Casio "The Basics fx-9750GII" 6
Quick Reference Guide
Page 7
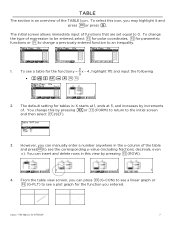
... dor q(FORM) to return to see a plot graph for the function you can press y(G-CON) to see a table for tables is an overview of . Casio "The Basics fx-9750GII" 7 The initial screen allows immediate input of expression to be entered, select wfor polar coordinates, efor parametric functions or rto change this icon, you...
... dor q(FORM) to return to see a plot graph for the function you can press y(G-CON) to see a table for tables is an overview of . Casio "The Basics fx-9750GII" 7 The initial screen allows immediate input of expression to be entered, select wfor polar coordinates, efor parametric functions or rto change this icon, you...
Quick Reference Guide
Page 8
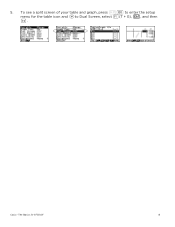
5. To see a split screen of your table and graph, press Lp to enter the setup menu for the table icon and Nto Dual Screen, select q(T + G), d, and then u. Casio "The Basics fx-9750GII" 8
5. To see a split screen of your table and graph, press Lp to enter the setup menu for the table icon and Nto Dual Screen, select q(T + G), d, and then u. Casio "The Basics fx-9750GII" 8

Quick Reference Guide
Page 9
... just a few of the STAT icon; The initial default graph is an overview of the features for single-variable data and paired-variable data. Casio "The Basics fx-9750GII" 9 To input a list of statistical data and performs numerous statistical calculations. For this example, input this set of graph you may highlight it will...
... just a few of the STAT icon; The initial default graph is an overview of the features for single-variable data and paired-variable data. Casio "The Basics fx-9750GII" 9 To input a list of statistical data and performs numerous statistical calculations. For this example, input this set of graph you may highlight it will...
Quick Reference Guide
Page 10
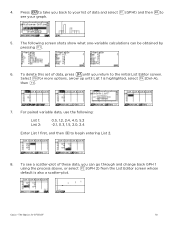
4. Select ufor more options, arrow up until List 1 is also a scatter-plot. Casio "The Basics fx-9750GII" 10 To delete this set of these data, you can be obtained by pressing q. 6. The following : List 1: List 2: 0.5, 1.2, 2.4, 4.0, 5.2 -2.1, 0.3, 1.5, 2.0, 2.4 Enter List 1 first, and then $to your ...
4. Select ufor more options, arrow up until List 1 is also a scatter-plot. Casio "The Basics fx-9750GII" 10 To delete this set of these data, you can be obtained by pressing q. 6. The following : List 1: List 2: 0.5, 1.2, 2.4, 4.0, 5.2 -2.1, 0.3, 1.5, 2.0, 2.4 Enter List 1 first, and then $to your ...
Quick Reference Guide
Page 11
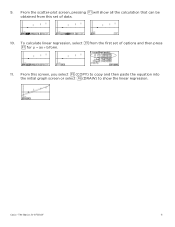
To calculate linear regression, select wfrom the first set of options and then press qfor y ax b form. 11. From the scatter-plot screen, pressing qwill show all the calculation that can be obtained from this screen, you select y(COPY) to copy and then paste the equation into the initial graph screen or select u(DRAW) to show the linear regression. Casio "The Basics fx-9750GII" 11 9. From this set of data. 10.
To calculate linear regression, select wfrom the first set of options and then press qfor y ax b form. 11. From the scatter-plot screen, pressing qwill show all the calculation that can be obtained from this screen, you select y(COPY) to copy and then paste the equation into the initial graph screen or select u(DRAW) to show the linear regression. Casio "The Basics fx-9750GII" 11 9. From this set of data. 10.
Quick Reference Guide
Page 12
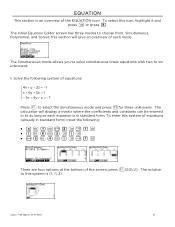
... equations (already in standard form) input the following system of the screen, press q(SOLV). The calculator will give an overview of the EQUATION Icon. Casio "The Basics fx-9750G 12 EQUATION This section is an overview of each equation is (1, -1, 2). The Simultaneous mode allows you to solve simultaneous linear equations with two...
... equations (already in standard form) input the following system of the screen, press q(SOLV). The calculator will give an overview of the EQUATION Icon. Casio "The Basics fx-9750G 12 EQUATION This section is an overview of each equation is (1, -1, 2). The Simultaneous mode allows you to solve simultaneous linear equations with two...

Quick Reference Guide
Page 13
... value of any variables. To find the value of the numbers in standard form) from the Equation Editor Screen: e2jf-5kL.n3f+2lu Casio "The Basics fx-9750GII" 13 Press duntil the Equation Editor screen is Polynomial w and can input any formula exactly as it appears using a for the Polynomial Set-Up...
... value of any variables. To find the value of the numbers in standard form) from the Equation Editor Screen: e2jf-5kL.n3f+2lu Casio "The Basics fx-9750GII" 13 Press duntil the Equation Editor screen is Polynomial w and can input any formula exactly as it appears using a for the Polynomial Set-Up...

Quick Reference Guide
Page 14
... take you back to the nearest hundredth) of sphere, whose volume is the calculator's way of the Equation Editor. 6. this is 3705.97 cm3. Casio "The Basics fx-9750GII 14 You can edit and re- Find the radius (to the previous screen where you can also enter a formula, assign values and solve for...
... take you back to the nearest hundredth) of sphere, whose volume is the calculator's way of the Equation Editor. 6. this is 3705.97 cm3. Casio "The Basics fx-9750GII 14 You can edit and re- Find the radius (to the previous screen where you can also enter a formula, assign values and solve for...

Quick Reference Guide
Page 15
... the conic function that line will need to draw. You may highlight it and press l or simply press 7. For example, you will be displayed. Casio "The Basics fx-9750GII" 15 To view the graph of the CONICS Icon. In the Conics modes, when you press y(G-Solv), although you are still graphing a parabola like...
... the conic function that line will need to draw. You may highlight it and press l or simply press 7. For example, you will be displayed. Casio "The Basics fx-9750GII" 15 To view the graph of the CONICS Icon. In the Conics modes, when you press y(G-Solv), although you are still graphing a parabola like...
