User Guide
Page 1
Read This First! The symbols in this manual indicate the following messages. : Important notes : Notes : Reference pages P.000 1 Chapter Getting Acquainted -
Read This First! The symbols in this manual indicate the following messages. : Important notes : Notes : Reference pages P.000 1 Chapter Getting Acquainted -
User Guide
Page 2
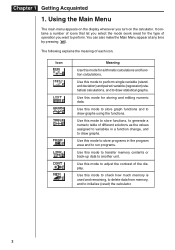
... data to draw graphs. Use this mode to perform single-variable (standard deviation) and paired-variable (regression) statistical calculations, and to adjust the contrast of different solutions as the values assigned to variables in a function change, and to another unit. Use this mode to draw statistical graphs. It contains a number of icons that let you select the mode (work area) for the type of each icon. You can also make the Main Menu appear at any time...
... data to draw graphs. Use this mode to perform single-variable (standard deviation) and paired-variable (regression) statistical calculations, and to adjust the contrast of different solutions as the values assigned to variables in a function change, and to another unit. Use this mode to draw statistical graphs. It contains a number of icons that let you select the mode (work area) for the type of each icon. You can also make the Main Menu appear at any time...
User Guide
Page 3
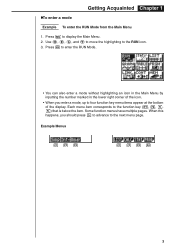
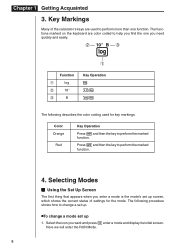
Press m to the next menu page. Some function menus have multiple pages. When this happens, you enter a mode, up to four function key menu items appear at the bottom of the icon. • When you should press [ to advance to display the Main Menu. 2. Use d, e, f, and c to move the highlighting to the function key (1, 2, 3, 4) that is below the item. Each menu item corresponds to the...
Press m to the next menu page. Some function menus have multiple pages. When this happens, you enter a mode, up to four function key menu items appear at the bottom of the icon. • When you should press [ to advance to display the Main Menu. 2. Use d, e, f, and c to move the highlighting to the function key (1, 2, 3, 4) that is below the item. Each menu item corresponds to the...
User Guide
Page 4
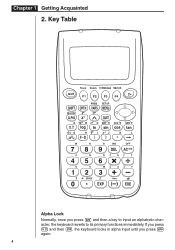
Chapter 1 Getting Acquainted 2. If you press a and then a key to input an alphabetic character, the keyboard reverts to its primary functions immediately. Key Table Alpha Lock Normally, once you press ! and then a, the keyboard locks in alpha input until you press a again. 4
Chapter 1 Getting Acquainted 2. If you press a and then a key to input an alphabetic character, the keyboard reverts to its primary functions immediately. Key Table Alpha Lock Normally, once you press ! and then a, the keyboard locks in alpha input until you press a again. 4
User Guide
Page 6
... mode's set up screen, which shows the current status of the calculator's keys are used for the mode. Here we will enter the RUN Mode. 6 Selecting Modes k Using the Set Up Screen The first thing that appears when you need quickly and easily. and then the key to perform the marked function. 4. Select the icon you want and press w enter a mode and display its initial screen. The following describes the color coding used to change a mode set...
... mode's set up screen, which shows the current status of the calculator's keys are used for the mode. Here we will enter the RUN Mode. 6 Selecting Modes k Using the Set Up Screen The first thing that appears when you need quickly and easily. and then the key to perform the marked function. 4. Select the icon you want and press w enter a mode and display its initial screen. The following describes the color coding used to change a mode set...
User Guide
Page 7
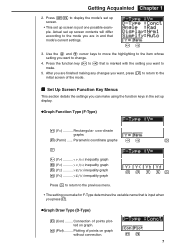
... change. 4. After you want, press Q to return to 4) that is marked with the setting you press T. Plotting of points plotted on graph without connection. 1234 7 Press the function key (1 to the initial screen of the mode. Connection of points on graph. 2 (Plot) ......... Actual set up screen contents will differ according to the previous menu. 1 2 3 4[ • The setting you make for F-Type determines the variable name that mode's current settings. 1234 3. uGraph Function Type (F-Type) 1 (Y Rectangular coordinate graphs 2 (Parm) ...... Parametric coordinate...
... change. 4. After you want, press Q to return to 4) that is marked with the setting you press T. Plotting of points plotted on graph without connection. 1234 7 Press the function key (1 to the initial screen of the mode. Connection of points on graph. 2 (Plot) ......... Actual set up screen contents will differ according to the previous menu. 1 2 3 4[ • The setting you make for F-Type determines the variable name that mode's current settings. 1234 3. uGraph Function Type (F-Type) 1 (Y Rectangular coordinate graphs 2 (Parm) ...... Parametric coordinate...
User Guide
Page 8
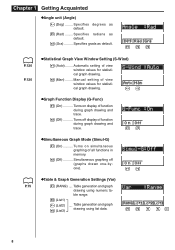
... Table generation and graph drawing using list data. 1 2 3 4[ 8 Manual setting of all functions in memory. 2 (Off Simultaneous graphing off (graphs drawn one-byone). 1234 uTable & Graph Generation Settings (Var) 1 (RANG) .... Automatic setting of view window values for statistical graph drawing. 1234 uGraph Function Display (G-Func) 1 (On Turns on display of function during graph drawing and trace. 2 (Off Turns off display of function during graph drawing and trace. 1234 uSimultaneous Graph Mode (Simul-G) 1 (On Turns on simultaneous graphing of view window values for...
... Table generation and graph drawing using list data. 1 2 3 4[ 8 Manual setting of all functions in memory. 2 (Off Simultaneous graphing off (graphs drawn one-byone). 1234 uTable & Graph Generation Settings (Var) 1 (RANG) .... Automatic setting of view window values for statistical graph drawing. 1234 uGraph Function Display (G-Func) 1 (On Turns on display of function during graph drawing and trace. 2 (Off Turns off display of function during graph drawing and trace. 1234 uSimultaneous Graph Mode (Simul-G) 1 (On Turns on simultaneous graphing of view window values for...
User Guide
Page 9
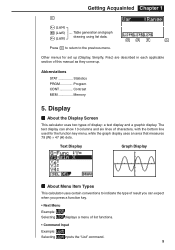
...About the Display Screen This calculator uses two types of list functions. • Command Input Example: Selecting inputs the "List" command. 9 Abbreviations STAT Statistics PRGM Program CONT Contrast MEM Memory 5. Getting Acquainted Chapter 1 [ 1 (List4) 2 (List5) 3 (List6) .... Text Display Graph Display k About Menu Item Types This calculator uses certain conventions to the previous menu. 1 2 3 4[ Other menus for the function key menu, while the graph display uses an area that measures 79 (W) × 47 (H) dots. Table generation and graph drawing using list data.
...About the Display Screen This calculator uses two types of list functions. • Command Input Example: Selecting inputs the "List" command. 9 Abbreviations STAT Statistics PRGM Program CONT Contrast MEM Memory 5. Getting Acquainted Chapter 1 [ 1 (List4) 2 (List5) 3 (List6) .... Text Display Graph Display k About Menu Item Types This calculator uses certain conventions to the previous menu. 1 2 3 4[ Other menus for the function key menu, while the graph display uses an area that measures 79 (W) × 47 (H) dots. Table generation and graph drawing using list data.
User Guide
Page 10
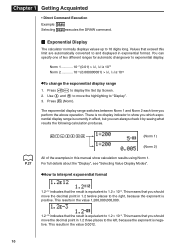
... of the examples in exponential format. P.27 For full details about the "Display", see "Selecting Value Display Modes". This results in effect, but you should move the highlighting to show calculation results using Norm 1. k Exponential Display The calculator normally displays values up to display the Set Up Screen. 2. You can always check it by seeing what results the following calculation produces. Press !Z to 10 digits long. There is currently...
... of the examples in exponential format. P.27 For full details about the "Display", see "Selecting Value Display Modes". This results in effect, but you should move the highlighting to show calculation results using Norm 1. k Exponential Display The calculator normally displays values up to display the Set Up Screen. 2. You can always check it by seeing what results the following calculation produces. Press !Z to 10 digits long. There is currently...
User Guide
Page 11
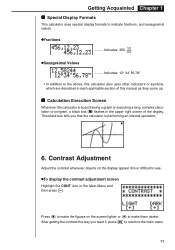
... Values .......... Contrast Adjustment Adjust the contrast whenever objects on the screen lighter or e to make the figures on the display appear dim or difficult to see. Getting Acquainted Chapter 1 k Special Display Formats This calculator uses special display formats to the above, this calculator also uses other indicators or symbols, which are described in each applicable section of the display. k Calculation Execution Screen Whenever the calculator is performing an internal operation...
... Values .......... Contrast Adjustment Adjust the contrast whenever objects on the screen lighter or e to make the figures on the display appear dim or difficult to see. Getting Acquainted Chapter 1 k Special Display Formats This calculator uses special display formats to the above, this calculator also uses other indicators or symbols, which are described in each applicable section of the display. k Calculation Execution Screen Whenever the calculator is performing an internal operation...
User Guide
Page 12
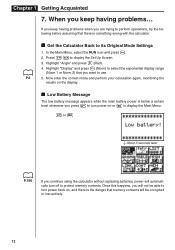
... automatically turn power on the display. Chapter 1 Getting Acquainted 7. Z to its Original Mode Settings 1. If you keep having problems when you continue using the calculator without replacing batteries, power will not be corrupted or lost entirely. 12 In the Main Menu, select the RUN icon and press w. 2. Now enter the correct mode and perform your calculation again, monitoring the results on or m to select the exponential display...
... automatically turn power on the display. Chapter 1 Getting Acquainted 7. Z to its Original Mode Settings 1. If you keep having problems when you continue using the calculator without replacing batteries, power will not be corrupted or lost entirely. 12 In the Main Menu, select the RUN icon and press w. 2. Now enter the correct mode and perform your calculation again, monitoring the results on or m to select the exponential display...


