

User Manual
Page 117
... Use the Data/Matrix Editor to create a one column) is automatically converted into a data variable (which can have multiple columns). Press 3 B 3 D D TEMP ¸ ¸ Display 2. Notice that a highlighted cell's ... one -column list variable. Press 1 ¸ 2 ¸ 3 ¸ 4 ¸ 5 ¸ 6 ¸ C Previews 117 Then move the cursor up one cell (just to display the Data/Matrix Editor. LIST is shown on the entry line). Then add a second column of information. Use O to see that the list variable (which can use D instead...
... Use the Data/Matrix Editor to create a one column) is automatically converted into a data variable (which can have multiple columns). Press 3 B 3 D D TEMP ¸ ¸ Display 2. Notice that a highlighted cell's ... one -column list variable. Press 1 ¸ 2 ¸ 3 ¸ 4 ¸ 5 ¸ 6 ¸ C Previews 117 Then move the cursor up one cell (just to display the Data/Matrix Editor. LIST is shown on the entry line). Then add a second column of information. Use O to see that the list variable (which can use D instead...
User Manual
Page 119
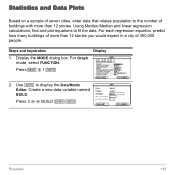
... stories you would expect in a city of buildings with more than 12 stories. For Graph mode, select FUNCTION. Display the MODE dialog box. Using Median-Median and linear regression calculations, find and plot equations to display the Data/Matrix Editor. Press 3 B 1 ¸ Display 2. Steps and keystrokes 1. Press 3 D D BUILD ¸ ¸ Previews 119 Use...
... stories you would expect in a city of buildings with more than 12 stories. For Graph mode, select FUNCTION. Display the MODE dialog box. Using Median-Median and linear regression calculations, find and plot equations to display the Data/Matrix Editor. Press 3 B 1 ¸ Display 2. Steps and keystrokes 1. Press 3 D D BUILD ¸ ¸ Previews 119 Use...
User Manual
Page 122
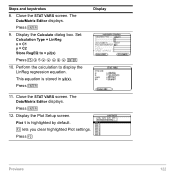
.... Plot 1 is stored in y2(x). lets you clear highlighted Plot settings. Display the Calculate dialog box. Display the Plot Setup screen. Press „ Previews 122 The Data/Matrix Editor displays. Steps and keystrokes 8. Close the STAT VARS screen. Set: Calculation Type = LinReg x = C1 y = C2 Store RegEQ to display the LinReg regression equation. Perform...
.... Plot 1 is stored in y2(x). lets you clear highlighted Plot settings. Display the Calculate dialog box. Display the Plot Setup screen. Press „ Previews 122 The Data/Matrix Editor displays. Steps and keystrokes 8. Close the STAT VARS screen. Set: Calculation Type = LinReg x = C1 y = C2 Store RegEQ to display the LinReg regression equation. Perform...

User Manual
Page 125
... as the values predicted by the LinReg line. To enter a title, the cursor must highlight the title cell at the very top of the Data/Matrix Editor. Enter a title for MedMed. When the cursor is on a header cell, pressing † is not required. Press O D ¸ ¸ 19. Return to the current...
... as the values predicted by the LinReg line. To enter a title, the cursor must highlight the title cell at the very top of the Data/Matrix Editor. Enter a title for MedMed. When the cursor is on a header cell, pressing † is not required. Press O D ¸ ¸ 19. Return to the current...

User Manual
Page 139
.... Display the VAR-LINK screen. Steps and keystrokes Display 1. From the Home screen, assign variables with the following variable types. Press 5 p 3. Expression: 5 !x1 Function: List: Matrix: x2+4 !f(x) {5,10} !L1 [30,25] !m1 Press " M 5 9 X1 ¸ X Z 2 « 4 9 j F c X d ¸ 2 [ 5 b 10 2 \ 9 j L1 ¸ 2 g 30 b 25 2 h 9 j M1 ¸ 2. can't remember its name. variables are locked...
.... Display the VAR-LINK screen. Steps and keystrokes Display 1. From the Home screen, assign variables with the following variable types. Press 5 p 3. Expression: 5 !x1 Function: List: Matrix: x2+4 !f(x) {5,10} !L1 [30,25] !m1 Press " M 5 9 X1 ¸ X Z 2 « 4 9 j F c X d ¸ 2 [ 5 b 10 2 \ 9 j L1 ¸ 2 g 30 b 25 2 h 9 j M1 ¸ 2. can't remember its name. variables are locked...

User Manual
Page 156
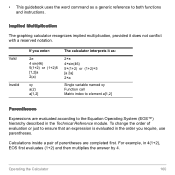
.... The dialog boxes that require numeric-only entries. Entering Numbers The keypad lets you enter positive and negative numbers for your graphing calculator evaluates a negation in relation to other functions, refer to the Equation Operating System (EOS™) hierarchy in the Text Editor...type a number, press j to "Entering Special Characters" in the Technical Reference Operating the Calculator 156 You can also enter numbers in dialog boxes that accept only numeric entries are: Resize Matrix, Zoom Factors, and Table Setup. For more information, refer to turn alpha-lock off....
.... The dialog boxes that require numeric-only entries. Entering Numbers The keypad lets you enter positive and negative numbers for your graphing calculator evaluates a negation in relation to other functions, refer to the Equation Operating System (EOS™) hierarchy in the Text Editor...type a number, press j to "Entering Special Characters" in the Technical Reference Operating the Calculator 156 You can also enter numbers in dialog boxes that accept only numeric entries are: Resize Matrix, Zoom Factors, and Table Setup. For more information, refer to turn alpha-lock off....
User Manual
Page 160
... call Matrix index to element a[1,2] Parentheses Expressions are completed first. Operating the Calculator 160 To change the order of parentheses are evaluated according to both functions and instructions. For example, in the order you enter: 2p 4 sin(46) 5(1+2) or (1+2)5 [1,2]a 2(a) xy a(2) a[1,2] The calculator interprets it does not conflict with a reserved notation. Implied Multiplication The graphing calculator...
... call Matrix index to element a[1,2] Parentheses Expressions are completed first. Operating the Calculator 160 To change the order of parentheses are evaluated according to both functions and instructions. For example, in the order you enter: 2p 4 sin(46) 5(1+2) or (1+2)5 [1,2]a 2(a) xy a(2) a[1,2] The calculator interprets it does not conflict with a reserved notation. Implied Multiplication The graphing calculator...
User Manual
Page 182
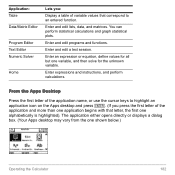
Enter and edit a text session. You can perform statistical calculations and graph statistical plots. Enter and edit lists, data, and matrices. Application: Table Data/Matrix Editor Program Editor Text Editor Numeric Solver Home Lets you press the first letter of variable values that ... table of the application and more than one application begins with that correspond to an entered function. Enter expressions and instructions, and perform calculations. The application either opens directly or displays a dialog box. (Your Apps desktop may vary from the one variable, and then solve...
Enter and edit a text session. You can perform statistical calculations and graph statistical plots. Enter and edit lists, data, and matrices. Application: Table Data/Matrix Editor Program Editor Text Editor Numeric Solver Home Lets you press the first letter of variable values that ... table of the application and more than one application begins with that correspond to an entered function. Enter expressions and instructions, and perform calculations. The application either opens directly or displays a dialog box. (Your Apps desktop may vary from the one variable, and then solve...
User Manual
Page 204
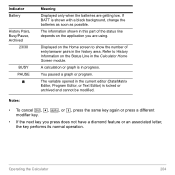
... press the same key again or press a different modifier key. • If the next key you are getting low. Operating the Calculator 204 You paused a graph or program. If BATT is locked or archived and cannot be modified. Refer to History Information on the Home screen to show the ...Indicator Battery History Pairs, Busy/Pause, Archived 23/30 BUSY PAUSE Œ Meaning Displayed only when the batteries are using. A calculation or graph is in the current editor (Data/Matrix Editor, Program Editor, or Text Editor) is shown with a black background, change the batteries as soon as possible.
... press the same key again or press a different modifier key. • If the next key you are getting low. Operating the Calculator 204 You paused a graph or program. If BATT is locked or archived and cannot be modified. Refer to History Information on the Home screen to show the ...Indicator Battery History Pairs, Busy/Pause, Archived 23/30 BUSY PAUSE Œ Meaning Displayed only when the batteries are using. A calculation or graph is in the current editor (Data/Matrix Editor, Program Editor, or Text Editor) is shown with a black background, change the batteries as soon as possible.
User Manual
Page 229
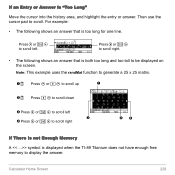
... one line. Note: This example uses the randMat function to generate a 25 x 25 matrix. Ê @ Press C or ¤ C to scroll up Ê Ë @ Press ¤ D to scroll down Ì Press A or 2 A to be displayed on the screen. Calculator Home Screen 229 For example: • The following shows an answer that is both.... Press A or 2 A to scroll left Í Press B or 2 B to scroll right Ì ËÍ If There Is not Enough Memory A > symbol is displayed when the TI-89 Titanium does not have enough free memory to scroll.
... one line. Note: This example uses the randMat function to generate a 25 x 25 matrix. Ê @ Press C or ¤ C to scroll up Ê Ë @ Press ¤ D to scroll down Ì Press A or 2 A to be displayed on the screen. Calculator Home Screen 229 For example: • The following shows an answer that is both.... Press A or 2 A to scroll left Í Press B or 2 B to scroll right Ì ËÍ If There Is not Enough Memory A > symbol is displayed when the TI-89 Titanium does not have enough free memory to scroll.

User Manual
Page 262
Enter the coefficients as a constant column matrix. Example Enter the coefficients as a matrix and the results as an augmented matrix. Note: The simult and rref matrix functions are not on the „ Algebra menu. Use 2 I 4 or the Catalog. Use the rref function with a matrix. Symbolic Manipulation 262 Method Use the simult function with a matrix.
Enter the coefficients as a constant column matrix. Example Enter the coefficients as a matrix and the results as an augmented matrix. Note: The simult and rref matrix functions are not on the „ Algebra menu. Use 2 I 4 or the Catalog. Use the rref function with a matrix. Symbolic Manipulation 262 Method Use the simult function with a matrix.
User Manual
Page 264
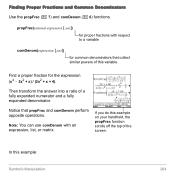
... function scrolls off the top of this example: Symbolic Manipulation 264 In this variable Find a proper fraction for proper fractions with an expression, list, or matrix. Notice that collect similar powers of the screen. propFrac(rational expression [,var]) for the expression (x4 N 2x2 + x) / (2x2 + x + 4). Then transform the answer into a ratio of...
... function scrolls off the top of this example: Symbolic Manipulation 264 In this variable Find a proper fraction for proper fractions with an expression, list, or matrix. Notice that collect similar powers of the screen. propFrac(rational expression [,var]) for the expression (x4 N 2x2 + x) / (2x2 + x + 4). Then transform the answer into a ratio of...
User Manual
Page 268
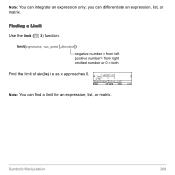
you can find a limit for an expression, list, or matrix. limit(expression, var, point [,direction]) negative number = from left positive number= from right omitted number or 0 = both Find the limit of sin(3x) / x as x approaches 0. Note: You can differentiate an expression, list, or matrix. Symbolic Manipulation 268 Note: You can integrate an expression only; Finding a Limit Use the limit (... 3) function.
you can find a limit for an expression, list, or matrix. limit(expression, var, point [,direction]) negative number = from left positive number= from right omitted number or 0 = both Find the limit of sin(3x) / x as x approaches 0. Note: You can differentiate an expression, list, or matrix. Symbolic Manipulation 268 Note: You can integrate an expression only; Finding a Limit Use the limit (... 3) function.
User Manual
Page 442
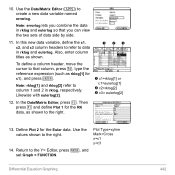
...;, type the reference expression (such as rklog[1] for c1), and press ¸. In the Data/Matrix Editor, press „. Return to create a new data variable named errorlog. Use the Data/Matrix Editor (O) to the Y= Editor, press 3, and set Graph = FUNCTION. 10. Use the values shown to the right. Ê c1=rklog[1] or c1... combine the data in rklog and eulerlog. Then press , and define Plot 1 for the Euler data. Plot Type=xyline Mark=Cross x=c1 y=c3 Differential Equation Graphing 442 Note: errorlog lets you can view the two sets of data side by side. 11.
...;, type the reference expression (such as rklog[1] for c1), and press ¸. In the Data/Matrix Editor, press „. Return to create a new data variable named errorlog. Use the Data/Matrix Editor (O) to the Y= Editor, press 3, and set Graph = FUNCTION. 10. Use the values shown to the right. Ê c1=rklog[1] or c1... combine the data in rklog and eulerlog. Then press , and define Plot 1 for the Euler data. Plot Type=xyline Mark=Cross x=c1 y=c3 Differential Equation Graphing 442 Note: errorlog lets you can view the two sets of data side by side. 11.
User Manual
Page 444
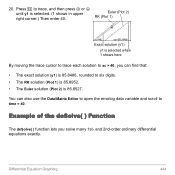
...20. to six digits. • The RK solution (Plot 1) is 85.8952. • The Euler solution (Plot 2) is 85.6527. Differential Equation Graphing 444 RK (Plot 1) Exact solution (y1) y1 is selected. (1 shows in upper Euler (Plot 2) right corner.) Then enter 40. Example of the ...deSolve( ) Function The deSolve( ) function lets you can also use the Data/Matrix Editor to open the errorlog data variable and scroll to time = 40. Press ... and 2nd-order ordinary differential equations exactly. You can find that: &#...
...20. to six digits. • The RK solution (Plot 1) is 85.8952. • The Euler solution (Plot 2) is 85.6527. Differential Equation Graphing 444 RK (Plot 1) Exact solution (y1) y1 is selected. (1 shows in upper Euler (Plot 2) right corner.) Then enter 40. Example of the ...deSolve( ) Function The deSolve( ) function lets you can also use the Data/Matrix Editor to open the errorlog data variable and scroll to time = 40. Press ... and 2nd-order ordinary differential equations exactly. You can find that: &#...
User Manual
Page 469
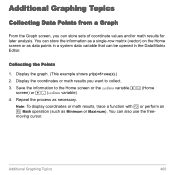
... (such as necessary. You can be opened in a system data variable that can also use the freemoving cursor. Additional Graphing Topics Collecting Data Points from a Graph From the Graph screen, you want to the Home screen or the sysData variable.8 · (Home screen) or 8 b (sysData variable... 1. Repeat the process as Minimum or Maximum). Display the graph. (This example shows y1(x)=5ùcos(x).) 2. You can store the information as a single-row matrix (vector) on the Home screen or as data points in the Data/Matrix Editor. Note: To display coordinates or math results, trace ...
... (such as necessary. You can be opened in a system data variable that can also use the freemoving cursor. Additional Graphing Topics Collecting Data Points from a Graph From the Graph screen, you want to the Home screen or the sysData variable.8 · (Home screen) or 8 b (sysData variable... 1. Repeat the process as Minimum or Maximum). Display the graph. (This example shows y1(x)=5ùcos(x).) 2. You can store the information as a single-row matrix (vector) on the Home screen or as data points in the Data/Matrix Editor. Note: To display coordinates or math results, trace ...
User Manual
Page 470
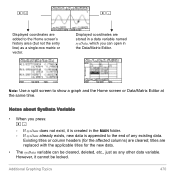
...named sysData, which you press: 8 b - Displayed coordinates are stored in the MAIN folder. - Additional Graphing Topics 470 If sysData does not exist, it cannot be cleared, deleted, etc., just as a single-row matrix or vector. 8 · 8 b Displayed coordinates are added to the Home screen's history area (but... not the entry line) as any existing data. Note: Use a split screen to show a graph and the Home screen or Data/Matrix Editor at the same time. Existing titles or column headers (for the new data. • The sysData variable can open...
...named sysData, which you press: 8 b - Displayed coordinates are stored in the MAIN folder. - Additional Graphing Topics 470 If sysData does not exist, it cannot be cleared, deleted, etc., just as a single-row matrix or vector. 8 · 8 b Displayed coordinates are added to the Home screen's history area (but... not the entry line) as any existing data. Note: Use a split screen to show a graph and the Home screen or Data/Matrix Editor at the same time. Existing titles or column headers (for the new data. • The sysData variable can open...

User Manual
Page 484
..., both sides use different graphing modes (as Coordinates, Axes, etc. • Graph screens. • Y= Editors. Independent graph-related applications (Y= Editor, Graph screen, etc.) can be displayed on only one Y= Editor, which maintains a single function list for each side shows a different function list. Additional Graphing Topics 484 Non-graph-related applications (Home screen, Data/Matrix Editor, etc.) are...
..., both sides use different graphing modes (as Coordinates, Axes, etc. • Graph screens. • Y= Editors. Independent graph-related applications (Y= Editor, Graph screen, etc.) can be displayed on only one Y= Editor, which maintains a single function list for each side shows a different function list. Additional Graphing Topics 484 Non-graph-related applications (Home screen, Data/Matrix Editor, etc.) are...
User Manual
Page 516
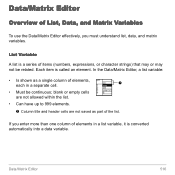
... Overview of items (numbers, expressions, or character strings) that may or may not be continuous; In the Data/Matrix Editor, a list variable: • Is shown as part of elements in a separate cell. Ê • Must be related. blank or empty cells are not allowed ... cells are not saved as a single column of elements, each in a list variable, it is called an element. If you must understand list, data, and matrix variables. Data/Matrix Editor 516 Each item is converted automatically into a data variable.
... Overview of items (numbers, expressions, or character strings) that may or may not be continuous; In the Data/Matrix Editor, a list variable: • Is shown as part of elements in a separate cell. Ê • Must be related. blank or empty cells are not allowed ... cells are not saved as a single column of elements, each in a list variable, it is called an element. If you must understand list, data, and matrix variables. Data/Matrix Editor 516 Each item is converted automatically into a data variable.
User Manual
Page 517
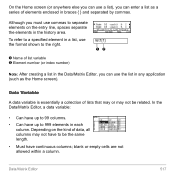
...data variable is essentially a collection of list variable Ë Element number (or index number) list1[1] ÊË Note: After creating a list in the Data/Matrix Editor, you must use the format shown to the right. Ê Name of lists that may or may not have to 99 columns. • Can... have continuous columns; blank or empty cells are not allowed within a column. Data/Matrix Editor 517 Although you can enter a list as the Home screen). To refer to a specified element in a list, use commas to 999 elements in...
...data variable is essentially a collection of list variable Ë Element number (or index number) list1[1] ÊË Note: After creating a list in the Data/Matrix Editor, you must use the format shown to the right. Ê Name of lists that may or may not have to 99 columns. • Can... have continuous columns; blank or empty cells are not allowed within a column. Data/Matrix Editor 517 Although you can enter a list as the Home screen). To refer to a specified element in a list, use commas to 999 elements in...


