
User Manual
Page 368
... x number of data points mean of y values sum of y values sum of y2 values sample standard deviation of y population standard deviation of y sum of analysis, all statistical variables are calculated and stored as indicated below under VARS menu. If you edit a list or change the type of x ... Then select the VARS menu shown in expressions, press... sx n minX 2.Var Stats v Gx Gx2 Sx sx n w Gy Gy2 Sy sy Gxy minX Other VARS menu XY G G XY XY XY XY G G XY XY G XY TI-83 Plus Statistics 365 To access these variables for use in the column below .
... x number of data points mean of y values sum of y values sum of y2 values sample standard deviation of y population standard deviation of y sum of analysis, all statistical variables are calculated and stored as indicated below under VARS menu. If you edit a list or change the type of x ... Then select the VARS menu shown in expressions, press... sx n minX 2.Var Stats v Gx Gx2 Sx sx n w Gy Gy2 Sy sy Gxy minX Other VARS menu XY G G XY XY XY XY G G XY XY G XY TI-83 Plus Statistics 365 To access these variables for use in the column below .

User Manual
Page 387
.... This time, use the Stats (summary statistics) input option. 7. TI-83 Plus Inferential Statistics and Distributions 384 To obtain a more precise bound on the population mean þ of 163.8 and sample standard deviation Sx of the sample þ used to contain the population mean height of 7.1 calculated from the larger random sample. Use a sample mean m of...
.... This time, use the Stats (summary statistics) input option. 7. TI-83 Plus Inferential Statistics and Distributions 384 To obtain a more precise bound on the population mean þ of 163.8 and sample standard deviation Sx of the sample þ used to contain the population mean height of 7.1 calculated from the larger random sample. Use a sample mean m of...

User Manual
Page 388
... distributed with a mean m of 165.1 centimeters and a standard deviation σ of 6.35 centimeters, what height is exceeded by only 5 percent of the women (the 95th percentile)? 10. Press † to move the cursor onto Calculate, and then press Í to n. 9. Press y = to clear the home screen. TI-83 Plus Inferential Statistics and Distributions 385 Press ' to...
... distributed with a mean m of 165.1 centimeters and a standard deviation σ of 6.35 centimeters, what height is exceeded by only 5 percent of the women (the 95th percentile)? 10. Press † to move the cursor onto Calculate, and then press Í to n. 9. Press y = to clear the home screen. TI-83 Plus Inferential Statistics and Distributions 385 Press ' to...

User Manual
Page 400
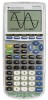
Calculated results: Drawn results: Data , Stats , Note: All STAT TESTS examples assume a fixed-decimal mode setting of the alternatives below. • Ha: mƒm0 (m:ƒm0) • Ha: mm0) TI-83 Plus Inferential Statistics and Distributions 397 If you set the decimal mode to Float or a different fixed-decimal setting, your output may ...examples. It tests the null hypothesis H0: m=m0 against one -sample t test; item 2) performs a hypothesis test for a single unknown population mean m when the population standard deviation s is unknown. T.Test T.Test (one of 4 (Chapter 1).
Calculated results: Drawn results: Data , Stats , Note: All STAT TESTS examples assume a fixed-decimal mode setting of the alternatives below. • Ha: mƒm0 (m:ƒm0) • Ha: mm0) TI-83 Plus Inferential Statistics and Distributions 397 If you set the decimal mode to Float or a different fixed-decimal setting, your output may ...examples. It tests the null hypothesis H0: m=m0 against one -sample t test; item 2) performs a hypothesis test for a single unknown population mean m when the population standard deviation s is unknown. T.Test T.Test (one of 4 (Chapter 1).

User Manual
Page 403
The null hypothesis H0: m1=m2 is known. Calculated results: , , Drawn results: 2.SampTTest 2.SampTTest (two-sample t test; item 4) tests the equality of the means of two populations (m1 and m2) based on independent samples when neither population standard deviation (s1 or s2) is tested against one of the alternatives below. • Ha: m1ƒm2 (m1:ƒm2) • Ha: m1m2) TI-83 Plus Inferential Statistics and Distributions 400
The null hypothesis H0: m1=m2 is known. Calculated results: , , Drawn results: 2.SampTTest 2.SampTTest (two-sample t test; item 4) tests the equality of the means of two populations (m1 and m2) based on independent samples when neither population standard deviation (s1 or s2) is tested against one of the alternatives below. • Ha: m1ƒm2 (m1:ƒm2) • Ha: m1m2) TI-83 Plus Inferential Statistics and Distributions 400

User Manual
Page 408
The computed confidence interval depends on the user-specified confidence level. In the example: L1={299.4 297.7 301 298.9 300.2 297} Data Stats Input: , , Calculated results: TI-83 Plus Inferential Statistics and Distributions 405 item 7) computes a confidence interval for an unknown population mean m when the population standard deviation s is known. ZInterval ZInterval (one-sample z confidence interval;
The computed confidence interval depends on the user-specified confidence level. In the example: L1={299.4 297.7 301 298.9 300.2 297} Data Stats Input: , , Calculated results: TI-83 Plus Inferential Statistics and Distributions 405 item 7) computes a confidence interval for an unknown population mean m when the population standard deviation s is known. ZInterval ZInterval (one-sample z confidence interval;

User Manual
Page 409
In the example: L6={1.6 1.7 1.8 1.9} Data Stats Input: , , Calculated results: TI-83 Plus Inferential Statistics and Distributions 406 TInterval TInterval (one-sample t confidence interval; The computed confidence interval depends on the user-specified confidence level. item 8) computes a confidence interval for an unknown population mean m when the population standard deviation s is unknown.
In the example: L6={1.6 1.7 1.8 1.9} Data Stats Input: , , Calculated results: TI-83 Plus Inferential Statistics and Distributions 406 TInterval TInterval (one-sample t confidence interval; The computed confidence interval depends on the user-specified confidence level. item 8) computes a confidence interval for an unknown population mean m when the population standard deviation s is unknown.

User Manual
Page 411
In the example: SAMP1={12.207 16.869 25.05 22.429 8.456 10.589} SAMP2={11.074 9.686 12.064 9.351 8.182 6.642} TI-83 Plus Inferential Statistics and Distributions 408 item 0) computes a confidence interval for the difference between two population means (m1Nm2) when both population standard deviations (s1 and s2) are unknown. The computed confidence interval depends on the userspecified confidence level. Calculated results: 2.SampTInt 2.SampTInt (two-sample t confidence interval;
In the example: SAMP1={12.207 16.869 25.05 22.429 8.456 10.589} SAMP2={11.074 9.686 12.064 9.351 8.182 6.642} TI-83 Plus Inferential Statistics and Distributions 408 item 0) computes a confidence interval for the difference between two population means (m1Nm2) when both population standard deviations (s1 and s2) are unknown. The computed confidence interval depends on the userspecified confidence level. Calculated results: 2.SampTInt 2.SampTInt (two-sample t confidence interval;

User Manual
Page 422
... be a real number > 0. Calculate displays the output on the home screen. In tests, Draw draws a graph of the list containing the data you are testing. The known population standard deviation from the first population for tests and intervals. must be integers | 0. Summary statistics (mean that they appear in this chapter. TI-83 Plus Inferential Statistics and...
... be a real number > 0. Calculate displays the output on the home screen. In tests, Draw draws a graph of the list containing the data you are testing. The known population standard deviation from the first population for tests and intervals. must be integers | 0. Summary statistics (mean that they appear in this chapter. TI-83 Plus Inferential Statistics and...
User Manual
Page 425
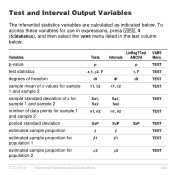
... degrees of freedom sample mean of x values for sample 1 and sample 2 sample standard deviation of x for sample 1 and sample 2 number of data points for sample 1 and sample 2 pooled standard deviation estimated sample proportion estimated sample proportion for population 1 estimated sample proportion for use in expressions... TEST SxP SxP SxP TEST Ç Ç TEST Ç1 Ç1 TEST Ç2 Ç2 TEST TI-83 Plus Inferential Statistics and Distributions 422 Test and Interval Output Variables The inferential statistics variables are calculated as indicated below .
... degrees of freedom sample mean of x values for sample 1 and sample 2 sample standard deviation of x for sample 1 and sample 2 number of data points for sample 1 and sample 2 pooled standard deviation estimated sample proportion estimated sample proportion for population 1 estimated sample proportion for use in expressions... TEST SxP SxP SxP TEST Ç Ç TEST Ç1 Ç1 TEST Ç2 Ç2 TEST TI-83 Plus Inferential Statistics and Distributions 422 Test and Interval Output Variables The inferential statistics variables are calculated as indicated below .

User Manual
Page 429
... m and standard deviation s. The defaults are m=0 and s=1. It calculates the x value associated with an area to the left of the x value. 0 area 1 must be true. normalcdf( normalcdf( computes the normal distribution probability between lowerbound and upperbound for a given area under the normal distribution curve specified by mean m and standard deviation s. invNorm(area[,m,s]) TI-83 Plus Inferential...
... m and standard deviation s. The defaults are m=0 and s=1. It calculates the x value associated with an area to the left of the x value. 0 area 1 must be true. normalcdf( normalcdf( computes the normal distribution probability between lowerbound and upperbound for a given area under the normal distribution curve specified by mean m and standard deviation s. invNorm(area[,m,s]) TI-83 Plus Inferential...


