
User Manual
Page 37
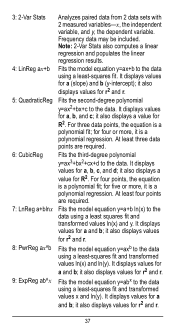
Frequency data may be included. Note: 2-Var Stats also computes a linear regression and populates the linear regression results. 4: LinReg ax+b Fits the model equation y=ax+b to the data using a least squares fit and transformed values ln(x) and y. it also displays a value for ...r2 and r. 9: ExpReg ab^x Fits the model equation y=abx to the data using a least-squares fit and transformed values ln(x) and ln(y). it is a polynomial regression. it also displays values for r2 and r. 37 it also displays values for r2 and r. 5: QuadraticReg Fits the second-degree polynomial y=ax2+bx+c to the...
Frequency data may be included. Note: 2-Var Stats also computes a linear regression and populates the linear regression results. 4: LinReg ax+b Fits the model equation y=ax+b to the data using a least squares fit and transformed values ln(x) and y. it also displays a value for ...r2 and r. 9: ExpReg ab^x Fits the model equation y=abx to the data using a least-squares fit and transformed values ln(x) and ln(y). it is a polynomial regression. it also displays values for r2 and r. 37 it also displays values for r2 and r. 5: QuadraticReg Fits the second-degree polynomial y=ax2+bx+c to the...
User Manual
Page 40
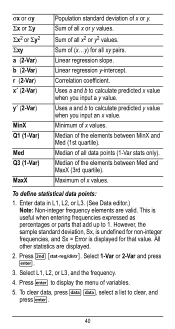
Sum of (x...y) for that add up to calculate predicted x value when you input an x value. Linear regression slope. Uses a and b to calculate predicted y value when you input a y value. Uses a and b to 1. However, the sample standard deviation, Sx, is undefined for non-integer ... data points (1-Var stats only). Enter data in L1, L2, or L3. (See Data editor.) Note: Non-integer frequency elements are displayed. 2. Sum of x values. Linear regression y-intercept.
Sum of (x...y) for that add up to calculate predicted x value when you input an x value. Linear regression slope. Uses a and b to calculate predicted y value when you input a y value. Uses a and b to 1. However, the sample standard deviation, Sx, is undefined for non-integer ... data points (1-Var stats only). Enter data in L1, L2, or L3. (See Data editor.) Note: Non-integer frequency elements are displayed. 2. Sum of x values. Linear regression y-intercept.
User Manual
Page 45
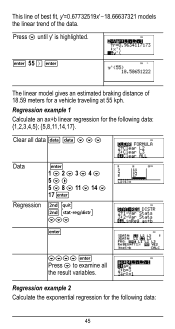
Regression example 1 Calculate an ax+b linear regression for the following data: 45 This line of best fit, y'=0.67732519x'N18.66637321 models the linear trend of 18.59 meters for a vehicle traveling at 55 kph. Clear all data v v $ $ $ Data Regression < 1 $ 2 $ 3 $ 4 $ 5 $ " 5 $ 8 $ 11 $ 14 $ 17 < %s % u $$$ < $$$$ < Press $ to examine all the result variables. Regression example 2 Calculate the exponential regression for the following data: {1,2,3,4,5}; {5,8,11,14,17}. Press $ until y' is highlighted. < 55 ) < The linear model gives an estimated braking distance of the data.
Regression example 1 Calculate an ax+b linear regression for the following data: 45 This line of best fit, y'=0.67732519x'N18.66637321 models the linear trend of 18.59 meters for a vehicle traveling at 55 kph. Clear all data v v $ $ $ Data Regression < 1 $ 2 $ 3 $ 4 $ 5 $ " 5 $ 8 $ 11 $ 14 $ 17 < %s % u $$$ < $$$$ < Press $ to examine all the result variables. Regression example 2 Calculate the exponential regression for the following data: {1,2,3,4,5}; {5,8,11,14,17}. Press $ until y' is highlighted. < 55 ) < The linear model gives an estimated braking distance of the data.

User Manual
Page 47
< 0 < 1 <
< 0 < 1 <
User Manual
Page 74
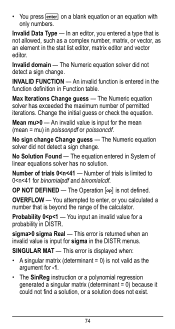
... number, matrix, or vector, as an element in poissonpdf or poissoncdf. Invalid domain - An invalid value is entered in the function definition in System of linear equations solver has no solution. No Solution Found - An invalid function is input for the mean (mean = mu) in the stat list editor, matrix editor...
... number, matrix, or vector, as an element in poissonpdf or poissoncdf. Invalid domain - An invalid value is entered in the function definition in System of linear equations solver has no solution. No Solution Found - An invalid function is input for the mean (mean = mu) in the stat list editor, matrix editor...


