
User Manual
Page 38
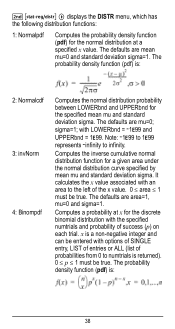
...Computes the normal distribution probability between LOWERbnd and UPPERbnd for a given area under the normal distribution curve specified by mean mu and standard deviation sigma. % u " displays the DISTR menu, which has the following distribution functions: 1: Normalpdf Computes the probability density function (... Computes a probability at x for the normal distribution at a specified x value. The defaults are mean mu and standard deviation sigma. sigma=1; The probability density function (pdf) is : 38 Computes the inverse cumulative normal distribution function for the specified mean mu=0...
...Computes the normal distribution probability between LOWERbnd and UPPERbnd for a given area under the normal distribution curve specified by mean mu and standard deviation sigma. % u " displays the DISTR menu, which has the following distribution functions: 1: Normalpdf Computes the probability density function (... Computes a probability at x for the normal distribution at a specified x value. The defaults are mean mu and standard deviation sigma. sigma=1; The probability density function (pdf) is : 38 Computes the inverse cumulative normal distribution function for the specified mean mu=0...
User Manual
Page 39
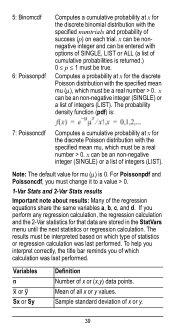
... menu until the next statistics or regression calculation. If you perform any regression calculation, the regression calculation and the 2-Var statistics for mu (m) is 0. Sample standard deviation of statistics or regression calculation was last performed.
... menu until the next statistics or regression calculation. If you perform any regression calculation, the regression calculation and the 2-Var statistics for mu (m) is 0. Sample standard deviation of statistics or regression calculation was last performed.
User Manual
Page 40
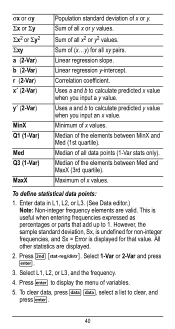
... you input an x value. Minimum of x or y. Median of the elements between MinX and Med (1st quartile). However, the sample standard deviation, Sx, is undefined for non-integer frequencies, and Sx = Error is useful when entering frequencies expressed as percentages or parts that value. Select...Gy2 Gxy a (2-Var) b (2-Var) r (2-Var) x¢ (2-Var) y¢ (2-Var) MinX Q1 (1-Var) Med Q3 (1-Var) MaxX Population standard deviation of x values. Linear regression y-intercept. This is displayed for all x2 or y2 values. Sum of the elements between Med and MaxX (3rd quartile). Correlation...
... you input an x value. Minimum of x or y. Median of the elements between MinX and Med (1st quartile). However, the sample standard deviation, Sx, is undefined for non-integer frequencies, and Sx = Error is useful when entering frequencies expressed as percentages or parts that value. Select...Gy2 Gxy a (2-Var) b (2-Var) r (2-Var) x¢ (2-Var) y¢ (2-Var) MinX Q1 (1-Var) Med Q3 (1-Var) MaxX Population standard deviation of x values. Linear regression y-intercept. This is displayed for all x2 or y2 values. Sum of the elements between Med and MaxX (3rd quartile). Correlation...


