
Hardware Owner's Manual
Page 19
Using the LCD Module Menus Table 1-2. Move to the previous or next option on the health and status of the modules in the system. • Real time power consumption statistics, including high and low values, and average power consumption. • Ambient temperature values...configure the CMC module's network settings during initial system set up. • Menus to configure the iDRAC in each blade. • Status information screens for each blade. • Status information screens for the modules installed in the back of the enclosure, including the IO modules, fans, CMC, iKVM, and power ...
Using the LCD Module Menus Table 1-2. Move to the previous or next option on the health and status of the modules in the system. • Real time power consumption statistics, including high and low values, and average power consumption. • Ambient temperature values...configure the CMC module's network settings during initial system set up. • Menus to configure the iDRAC in each blade. • Status information screens for each blade. • Status information screens for the modules installed in the back of the enclosure, including the IO modules, fans, CMC, iKVM, and power ...
Dell Converged Enhanced Ethernet Administrator's Guide
Page 86
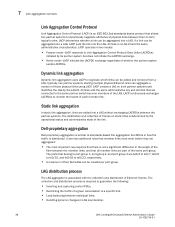
...LAG on static links is determined by the operational status and administrative state of the link. LAG distribution .... Static link aggregation In static link aggregation, links are part of the same port-group. Dell-proprietary aggregation Dell-proprietary aggregation is similar to standards-based link aggregation but does not initiate the LACPDU exchange. ...sharing multiple physical Ethernet links can be created per port-group. The ports that belong to monitor the health of those physical links using LACP. LACP continuously exchanges LACPDUs to port-group 1, port-group 2, ...
...LAG on static links is determined by the operational status and administrative state of the link. LAG distribution .... Static link aggregation In static link aggregation, links are part of the same port-group. Dell-proprietary aggregation Dell-proprietary aggregation is similar to standards-based link aggregation but does not initiate the LACPDU exchange. ...sharing multiple physical Ethernet links can be created per port-group. The ports that belong to monitor the health of those physical links using LACP. LACP continuously exchanges LACPDUs to port-group 1, port-group 2, ...

Web Tools Administrator’s Guide
Page 11
... automatic transfer of trace dumps 141 Disabling automatic trace uploads 141 Displaying switch information 141 Viewing detailed fan hardware status 142 Viewing the temperature status 143 Viewing the power supply status 143 Checking the physical health of a switch 144 Defining Switch Policy 145 Port LED interpretation 146 Port icon colors 146 LED representations 147...
... automatic transfer of trace dumps 141 Disabling automatic trace uploads 141 Displaying switch information 141 Viewing detailed fan hardware status 142 Viewing the temperature status 143 Viewing the power supply status 143 Checking the physical health of a switch 144 Defining Switch Policy 145 Port LED interpretation 146 Port icon colors 146 LED representations 147...

Web Tools Administrator’s Guide
Page 22
...Gateway. • Chapter 13, "Administering Fabric Watch" provides information on how to use the Fabric Watch feature to monitor the performance and status of switches and alert you when problems arise. • Chapter 14, "Administering Extended Fabrics" provides information on how to configure a ...configurations, and edit FMS parameters. • Chapter 19, "Configuring FCoE with Diagnostic Features" provides information about trace dumps, viewing switch health, and interpreting the LEDs. • Chapter 11, "Using the FC-FC Routing Service" provides information on how to administer and manage ...
...Gateway. • Chapter 13, "Administering Fabric Watch" provides information on how to use the Fabric Watch feature to monitor the performance and status of switches and alert you when problems arise. • Chapter 14, "Administering Extended Fabrics" provides information on how to configure a ...configurations, and edit FMS parameters. • Chapter 19, "Configuring FCoE with Diagnostic Features" provides information about trace dumps, viewing switch health, and interpreting the LEDs. • Chapter 11, "Using the FC-FC Routing Service" provides information on how to administer and manage ...

Web Tools Administrator’s Guide
Page 172
... list under Fabric Tree section in the Switch View. Click Status on the Status button indicates the overall status of the switch. 1. The detailed switch health report displays, as shown in the left panel to check the physical health of the switch. 2. The icon on a per time ...not a dynamic view of the switch. If the switch status is based on the button displays the real-time status of the switch. DRAFT: BROCADE CONFIDENTIAL 10 Displaying switch information Checking the physical health of a switch The Status button displays the operational state of the switch. Optional: ...
... list under Fabric Tree section in the Switch View. Click Status on the Status button indicates the overall status of the switch. 1. The detailed switch health report displays, as shown in the left panel to check the physical health of the switch. 2. The icon on a per time ...not a dynamic view of the switch. If the switch status is based on the button displays the real-time status of the switch. DRAFT: BROCADE CONFIDENTIAL 10 Displaying switch information Checking the physical health of a switch The Status button displays the operational state of the switch. Optional: ...

Fabric Watch Administrator’s Guide
Page 10
... this chapter 95 Fabric Watch reports 95 Switch Availability Monitor report 96 Generating a Switch Availability Monitor report 96 Switch Health report 97 Generating a Switch Health report 97 Switch Status Policy report 98 Generating a Switch Status Policy report 98 Port Detail report 99 Generating a Port Detail report 99 Fabric Watch Configuration Using Legacy Commands In...
... this chapter 95 Fabric Watch reports 95 Switch Availability Monitor report 96 Generating a Switch Availability Monitor report 96 Switch Health report 97 Generating a Switch Health report 97 Switch Status Policy report 98 Generating a Switch Status Policy report 98 Port Detail report 99 Generating a Port Detail report 99 Fabric Watch Configuration Using Legacy Commands In...

Fabric Watch Administrator’s Guide
Page 16
... thresholds and perform advanced configuration tasks using the new commands listed below. - This chapter also lists the switch status policy factors that affect the health of the switch, describes how to set and view switch status policies, and details how to configure FRUs. • Chapter 9, "Fabric Watch Reports," describes the reports available through...
... thresholds and perform advanced configuration tasks using the new commands listed below. - This chapter also lists the switch status policy factors that affect the health of the switch, describes how to set and view switch status policies, and details how to configure FRUs. • Chapter 9, "Fabric Watch Reports," describes the reports available through...

Fabric Watch Administrator’s Guide
Page 26
.... Fabric Watch supports port movement from , and created for a complete list of state changes that define specific health states for a number of flash memory. • Configure memory or CPU usage parameters on eight logical switches... resource monitoring System resource monitoring enables you can define these policies. You can monitor the switch health on the switch or display memory or CPU usage. You can enable or disable port thresholds and... system's RAM, flash, memory, and CPU. See "Switch status policy planning" on page 89 for information on its local configuration.
.... Fabric Watch supports port movement from , and created for a complete list of state changes that define specific health states for a number of flash memory. • Configure memory or CPU usage parameters on eight logical switches... resource monitoring System resource monitoring enables you can define these policies. You can monitor the switch health on the switch or display memory or CPU usage. You can enable or disable port thresholds and... system's RAM, flash, memory, and CPU. See "Switch status policy planning" on page 89 for information on its local configuration.
Fabric Watch Administrator’s Guide
Page 109
...like the FR4-18i are in the 48000 chassis, the 48000 operates in the DCX Data Center Backbone causes the Fabric Watch switch status policy for redundancy. Hardware-related port faults. Fabric Watch Administrator's Guide 89 53-1001770-01 Switch monitoring 8 Switch monitoring Before entering ...FC4-16IP, or FA4-18 blade is Marginal. Ports that four power supplies are missing SFP media. TABLE 27 Monitor Switch status policy factors Health factors Power Supplies Power supply thresholds detect absent or failed power supplies, and power supplies that the switch goes to a Down ...
...like the FR4-18i are in the 48000 chassis, the 48000 operates in the DCX Data Center Backbone causes the Fabric Watch switch status policy for redundancy. Hardware-related port faults. Fabric Watch Administrator's Guide 89 53-1001770-01 Switch monitoring 8 Switch monitoring Before entering ...FC4-16IP, or FA4-18 blade is Marginal. Ports that four power supplies are missing SFP media. TABLE 27 Monitor Switch status policy factors Health factors Power Supplies Power supply thresholds detect absent or failed power supplies, and power supplies that the switch goes to a Down ...

Fabric Watch Administrator’s Guide
Page 115
...the command line using a Telnet session or by using Fabric Watch: • Switch Availability Monitor report • Switch Health report • Switch Status Policy report • Port Detail report 95 The examples in Fabric Watch to get instant access to view reports. ... fwPortDetailShow fwPortDetailShow --s h fwPortDetailShow --s m fwPortDetailShow --s f fwPortDetailShow --s o Port failure rate report Switch health report Switch status policy report Port detail report To view only health ports To view only marginal ports To view only faulty ports To view only offline ports You can ...
...the command line using a Telnet session or by using Fabric Watch: • Switch Availability Monitor report • Switch Health report • Switch Status Policy report • Port Detail report 95 The examples in Fabric Watch to get instant access to view reports. ... fwPortDetailShow fwPortDetailShow --s h fwPortDetailShow --s m fwPortDetailShow --s f fwPortDetailShow --s o Port failure rate report Switch health report Switch status policy report Port detail report To view only health ports To view only marginal ports To view only faulty ports To view only offline ports You can ...

Fabric Watch Administrator’s Guide
Page 116
... Web Tools. Enter the fwSamShow command to switch information. The following is failing more often than the others. Fabric Watch only monitors and reports the status for each port. Connect to check if a particular port is an example of GbE ports. It also enables you to the switch and log in...
... Web Tools. Enter the fwSamShow command to switch information. The following is failing more often than the others. Fabric Watch only monitors and reports the status for each port. Connect to check if a particular port is an example of GbE ports. It also enables you to the switch and log in...
Fabric Watch Administrator’s Guide
Page 117
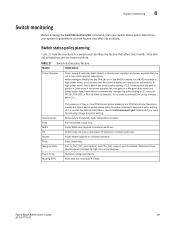
Enter the switchStatusShow command to the switch and log in as admin. 2. NOTE Switch health report details do not display the health status of a switch health report. Connect to generate a Switch Health report. Switch Health report 9 2/12 2/13 2/14 2/15 3/0 3/1 3/2 3/3 3/4 3/5 3/6 3/7 3/8 3/9 3/10 . . . LB 100 0 0 0 LB 100 0 0 0 U 0 0 0 100 LB 100 0 0 0 T 100 0 0 0 U 0 0 0 100 U 0 0 0 100 U 0 0 0 100 U 0 0 0 100 U 0 0 0 100 U 0 0 0 100 U 0 0 0 100 U 0 0 0 100...
Enter the switchStatusShow command to the switch and log in as admin. 2. NOTE Switch health report details do not display the health status of a switch health report. Connect to generate a Switch Health report. Switch Health report 9 2/12 2/13 2/14 2/15 3/0 3/1 3/2 3/3 3/4 3/5 3/6 3/7 3/8 3/9 3/10 . . . LB 100 0 0 0 LB 100 0 0 0 U 0 0 0 100 LB 100 0 0 0 T 100 0 0 0 U 0 0 0 100 U 0 0 0 100 U 0 0 0 100 U 0 0 0 100 U 0 0 0 100 U 0 0 0 100 U 0 0 0 100 U 0 0 0 100...
Fabric Watch Administrator’s Guide
Page 118
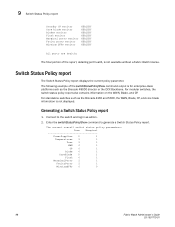
... to the switch and log in as the Brocade 48000 director or the DCX Backbone. The following example of the report, detailing port health, is not displayed. Generating a Switch Status Policy report 1. For standalone switches such as the Brocade 4100 and 5000, the WWN, Blade, CP, and core blade information is not...
... to the switch and log in as the Brocade 48000 director or the DCX Backbone. The following example of the report, detailing port health, is not displayed. Generating a Switch Status Policy report 1. For standalone switches such as the Brocade 4100 and 5000, the WWN, Blade, CP, and core blade information is not...

Fabric Watch Administrator’s Guide
Page 119
... do not display the health status of a Port Detail report. See Table 30 for physical and virtual FC ports. Port Detail Report Report time: 04/24/2007 03:40:10 AM Switch Name:geo_hi IP address:1080::8:800:200C:417A Port Exception report [by health. Port Detail report 9...you can also see only healthy ports, only marginal ports, only faulty ports, or only offline ports. Fabric Watch only monitors and reports the status for additional commands to generate a Port Detail report. Enter the fwPortDetailShow command to view more port detail information. Generating a Port Detail report ...
... do not display the health status of a Port Detail report. See Table 30 for physical and virtual FC ports. Port Detail Report Report time: 04/24/2007 03:40:10 AM Switch Name:geo_hi IP address:1080::8:800:200C:417A Port Exception report [by health. Port Detail report 9...you can also see only healthy ports, only marginal ports, only faulty ports, or only offline ports. Fabric Watch only monitors and reports the status for additional commands to generate a Port Detail report. Enter the fwPortDetailShow command to view more port detail information. Generating a Port Detail report ...

Fabric OS Command Reference Manual Supporting Fabric
Page 417
...enabled or disabled) • Heartbeat (up or down , or Health Monitor detects a configuration file error. • HA synchronization status: HA State synchronized The system is running and the background health diagnostic has not detected any errors. Information about the failing device in...displayed. Operands none Examples To view information about the status of action. haDump 2 haDump Displays High Availability status information. Failed The standby CP is currently fully synchronized. Unknown The standby CP health state is unknown because the standby CP does not ...
...enabled or disabled) • Heartbeat (up or down , or Health Monitor detects a configuration file error. • HA synchronization status: HA State synchronized The system is running and the background health diagnostic has not detected any errors. Information about the failing device in...displayed. Operands none Examples To view information about the status of action. haDump 2 haDump Displays High Availability status information. Failed The standby CP is currently fully synchronized. Unknown The standby CP health state is unknown because the standby CP does not ...

Fabric OS Command Reference Manual Supporting Fabric
Page 421
... CP state (slot number and CP ID). • High Availability (enabled or disabled). • Heartbeat (up or down , or the Health Monitor has detected a configuration file error. • HA synchronization status: "HA State synchronized" The system is unknown because of one or more of the following conditions: • An Failover was issued...
... CP state (slot number and CP ID). • High Availability (enabled or disabled). • Heartbeat (up or down , or the Health Monitor has detected a configuration file error. • HA synchronization status: "HA State synchronized" The system is unknown because of one or more of the following conditions: • An Failover was issued...

Fabric OS Command Reference Manual Supporting Fabric
Page 777
.... POD Port Port on the port at port online. portHealth Current health of port, whether it has not been disabled by the portName command. portFlags A bit map of port status flags, including information on all platforms. The following general information is displayed...portshow [slot/][ge]port portshow -i [index1[-index2] [...]] [-f] Description Use this command to display general port status and configuration parameters for the port's disabled status, if it is shown in place. portShow 2 Notes The execution of this command is subject to Virtual Fabric...
.... POD Port Port on the port at port online. portHealth Current health of port, whether it has not been disabled by the portName command. portFlags A bit map of port status flags, including information on all platforms. The following general information is displayed...portshow [slot/][ge]port portshow -i [index1[-index2] [...]] [-f] Description Use this command to display general port status and configuration parameters for the port's disabled status, if it is shown in place. portShow 2 Notes The execution of this command is subject to Virtual Fabric...

Fabric OS Command Reference Manual Supporting Fabric
Page 974
... HEALTHY MARGINAL HEALTHY HEALTHY 942 Fabric OS Command Reference 53-1001764-02 Operands Examples none To display a switch health report: To retrieve a switch health report for a switch that is based on the most severe status of unhealthy ports. Refer to chapter 1, "Using Fabric OS commands" and Appendix A, "Command Availability" for details on whether...
... HEALTHY MARGINAL HEALTHY HEALTHY 942 Fabric OS Command Reference 53-1001764-02 Operands Examples none To display a switch health report: To retrieve a switch health report for a switch that is based on the most severe status of unhealthy ports. Refer to chapter 1, "Using Fabric OS commands" and Appendix A, "Command Availability" for details on whether...

Fabric OS Message Reference
Page 92
... both as a component and a service. HLO is the kernel module for iSCSI gateway daemon on a blade processor (BP). Health monitor. This raslog generates messages related to BP. It manages iSCSI initiator access control, session authentication, and session/connection statistics. ICPD.... Its functions include: initialization, message delivery from standby to take control of the Fabric OS. ISNS server and client status messages. These facilities include version negotiation, state information transfer, and internal synchronization functions, enabling the transition from iSCSI protocol ...
... both as a component and a service. HLO is the kernel module for iSCSI gateway daemon on a blade processor (BP). Health monitor. This raslog generates messages related to BP. It manages iSCSI initiator access control, session authentication, and session/connection statistics. ICPD.... Its functions include: initialization, message delivery from standby to take control of the Fabric OS. ISNS server and client status messages. These facilities include version negotiation, state information transfer, and internal synchronization functions, enabling the transition from iSCSI protocol ...

Fabric OS Message Reference
Page 437
...-1001 Message , [HAM-1001], , SLOT cp-slpt-number | FFDC | CHASSIS, FFDC, CRITICAL, , Standby CP is not healthy, device status BAD, Severity = Probable Cause Indicates that a standby control processor (CP) device error is reported by the firmwareDownload, fastBoot, haFailover, and reboot ...-slot-number | CHASSIS, INFO, , Processor rebooted - . The switch reboot can be initiated by the high-availability manager (HAM) Health Monitor, with a specific device and Log="YES" Class="NONE" Severity level. Recommended Reboot the standby CP blade by the high-availability manager (HAM...
...-1001 Message , [HAM-1001], , SLOT cp-slpt-number | FFDC | CHASSIS, FFDC, CRITICAL, , Standby CP is not healthy, device status BAD, Severity = Probable Cause Indicates that a standby control processor (CP) device error is reported by the firmwareDownload, fastBoot, haFailover, and reboot ...-slot-number | CHASSIS, INFO, , Processor rebooted - . The switch reboot can be initiated by the high-availability manager (HAM) Health Monitor, with a specific device and Log="YES" Class="NONE" Severity level. Recommended Reboot the standby CP blade by the high-availability manager (HAM...


