Quick Reference Guide
Page 2
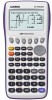
...memory. SYSTEM This icon menu is used to perform single-variable (standard deviation) and paired variable (regression) statistical calculations, to perform tests, to analyze data and to graph parabolas, circles, ellipses, and...stored in a function change , and to solve linear equations with two through six unknowns, and high-order equations from http://edu.casio.com. This icon menu is used to draw statistical...other system settings. 1 BASIC FUNCTIONALITY fx-9"7Th5e0BGasIicIs" CASIO fx-9750GII The following explains the meaning of different solutions as the values assigned to 6th degree...
...memory. SYSTEM This icon menu is used to perform single-variable (standard deviation) and paired variable (regression) statistical calculations, to perform tests, to analyze data and to graph parabolas, circles, ellipses, and...stored in a function change , and to solve linear equations with two through six unknowns, and high-order equations from http://edu.casio.com. This icon menu is used to draw statistical...other system settings. 1 BASIC FUNCTIONALITY fx-9"7Th5e0BGasIicIs" CASIO fx-9750GII The following explains the meaning of different solutions as the values assigned to 6th degree...

Quick Reference Guide
Page 9
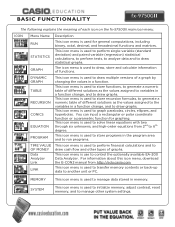
To change the type of data: 1, 0.5, 1.2, 4, -1, 1, 3, 5, 6, 3.4 2. Casio "The Basics fx-9750GII" 9 To select this set of graph you would like to use, press q(GRPH), then u(SET), Nto Graph Type:, for single-variable ... this icon, you single or paired-variable data (scatter-plot, line, normal probability, histogram, median box, mean box, normal distribution, broken line, and regression: linear, quadratic, cubic, quartic, logarithmic, exponential, power, sinusoidal and logistic). 3. The initial List Editor Screen that allows input of single-variable data, highlight the...
To change the type of data: 1, 0.5, 1.2, 4, -1, 1, 3, 5, 6, 3.4 2. Casio "The Basics fx-9750GII" 9 To select this set of graph you would like to use, press q(GRPH), then u(SET), Nto Graph Type:, for single-variable ... this icon, you single or paired-variable data (scatter-plot, line, normal probability, histogram, median box, mean box, normal distribution, broken line, and regression: linear, quadratic, cubic, quartic, logarithmic, exponential, power, sinusoidal and logistic). 3. The initial List Editor Screen that allows input of single-variable data, highlight the...
Quick Reference Guide
Page 11
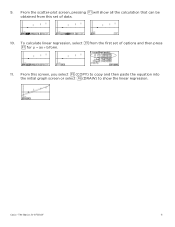
From the scatter-plot screen, pressing qwill show the linear regression. To calculate linear regression, select wfrom the first set of options and then press qfor y ax b form. 11. Casio "The Basics fx-9750GII" 11 From this screen, you select y(COPY) to copy and then paste the equation into the initial graph screen or select u(DRAW) to show all the calculation that can be obtained from this set of data. 10. 9.
From the scatter-plot screen, pressing qwill show the linear regression. To calculate linear regression, select wfrom the first set of options and then press qfor y ax b form. 11. Casio "The Basics fx-9750GII" 11 From this screen, you select y(COPY) to copy and then paste the equation into the initial graph screen or select u(DRAW) to show all the calculation that can be obtained from this set of data. 10. 9.


