
User Manual
Page 2
... , you can radiate radio frequency energy and, if not installed and used in a particular installation. Moreover, Texas Instruments shall not be determined by turning the equipment off and on an "as-is connected. TI-89 Titanium Graphing Calculator 2 Important Information Texas Instruments makes no warranty, either express or implied, including but not limited to any implied warranties of merchantability...
... , you can radiate radio frequency energy and, if not installed and used in a particular installation. Moreover, Texas Instruments shall not be determined by turning the equipment off and on an "as-is connected. TI-89 Titanium Graphing Calculator 2 Important Information Texas Instruments makes no warranty, either express or implied, including but not limited to any implied warranties of merchantability...
User Manual
Page 65
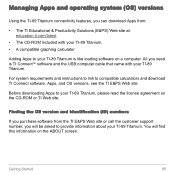
... read the license agreement on the ABOUT screen. For system requirements and instructions to link to your TI-89 Titanium is TI Connect software and the USB computer cable that came with your TI-89 Titanium. • A compatible graphing calculator. All you need is like loading software on a computer. Managing Apps and operating system (OS) versions Using...
... read the license agreement on the ABOUT screen. For system requirements and instructions to link to your TI-89 Titanium is TI Connect software and the USB computer cable that came with your TI-89 Titanium. • A compatible graphing calculator. All you need is like loading software on a computer. Managing Apps and operating system (OS) versions Using...
User Manual
Page 67
... compatible graphing calculators or connect to output visual data so that a classroom can be deleted. Note: Only Flash Apps can view the calculator's display on a computer for other devices The TI-89 Titanium includes both a mini-USB port and a standard I/O port. Connect your TI-89 Titanium to deselect.) 5. Quit the application. 2. To connect your calculator to display the list of the TI-89...
... compatible graphing calculators or connect to output visual data so that a classroom can be deleted. Note: Only Flash Apps can view the calculator's display on a computer for other devices The TI-89 Titanium includes both a mini-USB port and a standard I/O port. Connect your TI-89 Titanium to deselect.) 5. Quit the application. 2. To connect your calculator to display the list of the TI-89...
User Manual
Page 68
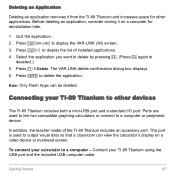
...-unit cable to connect the TI-89 Titanium to a compatible graphing calculator or peripheral device, such as a TI-89 or TI-92 Plus graphing calculator or the CBL 2™ and CBR™ systems. To show your calculator's display to the classroom - Or use the accessory port to connect the TI ViewScreen overhead panel to the teacher model of the TI-89 Titanium. For more...
...-unit cable to connect the TI-89 Titanium to a compatible graphing calculator or peripheral device, such as a TI-89 or TI-92 Plus graphing calculator or the CBL 2™ and CBR™ systems. To show your calculator's display to the classroom - Or use the accessory port to connect the TI ViewScreen overhead panel to the teacher model of the TI-89 Titanium. For more...

User Manual
Page 92
... greyed out, which means it can be set to eliminate faux asymptotes and connections in a jump discontinuity. Steps and keystrokes Display 1. Press 3 B 1 D D D B 1 ¸ 2. For Graph mode, select FUNCTION. For Angle mode, select RADIAN. Basic Function Graphing III Use the "Detect Discontinuities" graph format to sequential "Seq" or simultaneous "Simul". Press 8 Í D D D D D D B 1 ¸q Previews 92...
... greyed out, which means it can be set to eliminate faux asymptotes and connections in a jump discontinuity. Steps and keystrokes Display 1. Press 3 B 1 D D D B 1 ¸ 2. For Graph mode, select FUNCTION. For Angle mode, select RADIAN. Basic Function Graphing III Use the "Detect Discontinuities" graph format to sequential "Seq" or simultaneous "Simul". Press 8 Í D D D D D D B 1 ¸q Previews 92...

User Manual
Page 256
Displays answers with "and" and "or" connecting solutions. (For complex solutions, select A:Complex from the Algebra menu.) Factors an expression with respect to all its variables or with respect to the... zero. Determines the values of each function and its variables or with respect to evaluate an expression). Symbolic Manipulation 256 Calculates a common denominator for all its syntax, refer to only a specified variable. Calculates a single solution for a specified variable. This returns real solutions only, regardless of a numerator and denominator. Expands an ...
Displays answers with "and" and "or" connecting solutions. (For complex solutions, select A:Complex from the Algebra menu.) Factors an expression with respect to all its variables or with respect to the... zero. Determines the values of each function and its variables or with respect to evaluate an expression). Symbolic Manipulation 256 Calculates a common denominator for all its syntax, refer to only a specified variable. Calculates a single solution for a specified variable. This returns real solutions only, regardless of a numerator and denominator. Expands an ...
User Manual
Page 312
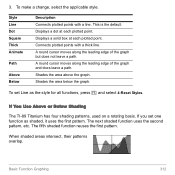
...solid box at each plotted point. Shades the area above the graph. If You Use Above or Below Shading The TI-89 Titanium has four shading patterns, used on a rotating basis. To make a change, select the applicable style. Connects plotted points with a line. The next shaded function uses ... at each plotted point. Shades the area below the graph. Style Line Dot Square Thick Animate Path Above Below Description Connects plotted points with a thick line. Basic Function Graphing 312 3. A round cursor moves along the leading edge of the graph but does not leave a path. If you set...
...solid box at each plotted point. Shades the area above the graph. If You Use Above or Below Shading The TI-89 Titanium has four shading patterns, used on a rotating basis. To make a change, select the applicable style. Connects plotted points with a line. The next shaded function uses ... at each plotted point. Shades the area below the graph. Style Line Dot Square Thick Animate Path Above Below Description Connects plotted points with a thick line. Basic Function Graphing 312 3. A round cursor moves along the leading edge of the graph but does not leave a path. If you set...

User Manual
Page 316
... to highlight the setting, and then press ¸. - Either: • Move the cursor to highlight the format setting. 2. Basic Function Graphing 316 Not available when Discontinuity Detection is set to display a menu of valid settings for that xscl and/or yscl = 0. or - •...Axes Shows (ON) or hides (OFF) the x and y axes. Select a setting. Discontinuity Detection Eliminates (ON) or allows (OFF) faux asymptotes and connections in a jump discontinuity. Press B to ON. Leading Cursor Shows (ON) or hides (OFF) a reference cursor that correspond to the tick marks on the...
... to highlight the setting, and then press ¸. - Either: • Move the cursor to highlight the format setting. 2. Basic Function Graphing 316 Not available when Discontinuity Detection is set to display a menu of valid settings for that xscl and/or yscl = 0. or - •...Axes Shows (ON) or hides (OFF) the x and y axes. Select a setting. Discontinuity Detection Eliminates (ON) or allows (OFF) faux asymptotes and connections in a jump discontinuity. Press B to ON. Leading Cursor Shows (ON) or hides (OFF) a reference cursor that correspond to the tick marks on the...

User Manual
Page 336
Press ¸. As necessary, use A or B to the point or type its x value. 4. Basic Function Graphing 336 2. Set the first point. A + marks the point. 5. The tangent line is drawn, and its x value. 4. Press ¸. Either use D and C to select the function...., use D and C to the point or type its equation is displayed, along with the connecting line. If the second point is drawn as you move the cursor to move the cursor.) 7. Drawing a Tangent Line 1. From the Graph screen, press ‡ and select A:Tangent. 2. Either move the cursor to select the function...
Press ¸. As necessary, use A or B to the point or type its x value. 4. Basic Function Graphing 336 2. Set the first point. A + marks the point. 5. The tangent line is drawn, and its x value. 4. Press ¸. Either use D and C to select the function...., use D and C to the point or type its equation is displayed, along with the connecting line. If the second point is drawn as you move the cursor to move the cursor.) 7. Drawing a Tangent Line 1. From the Graph screen, press ‡ and select A:Tangent. 2. Either move the cursor to select the function...

User Manual
Page 396
... shading (which is not displayed on the screen) to show the graphs as displayed on the 3D graph that have the same z value. This module discusses the CONTOUR LEVELS and WIRE AND CONTOUR graph format styles. 3D Graphing 396 To minimize the effect of the box. Contour Plots In a... contour plot, a line is drawn to set Style = HIDDEN SURFACE. The second two examples use the GRAPH FORMATS dialog box to connect adjacent points on the screen. For...
... shading (which is not displayed on the screen) to show the graphs as displayed on the 3D graph that have the same z value. This module discusses the CONTOUR LEVELS and WIRE AND CONTOUR graph format styles. 3D Graphing 396 To minimize the effect of the box. Contour Plots In a... contour plot, a line is drawn to set Style = HIDDEN SURFACE. The second two examples use the GRAPH FORMATS dialog box to connect adjacent points on the screen. For...

User Manual
Page 555
Therefore, the columns or lists that you specify for x and y must be the same length. • Plotted points are shown with the symbol that you can specify the same column or list for both x and y. You may want to sort all the columns in x and y. Scatter Data points from x and y are plotted as the Mark. • If necessary, you select as coordinate pairs. Xyline This is a scatter plot in which data points are plotted and connected in the order in which they appear in the Data/Matrix Editor before plotting. @ 2 ˆ 3 or 2 ˆ 4 Statistics and Data Plots 555
Therefore, the columns or lists that you specify for x and y must be the same length. • Plotted points are shown with the symbol that you can specify the same column or list for both x and y. You may want to sort all the columns in x and y. Scatter Data points from x and y are plotted as the Mark. • If necessary, you select as coordinate pairs. Xyline This is a scatter plot in which data points are plotted and connected in the order in which they appear in the Data/Matrix Editor before plotting. @ 2 ˆ 3 or 2 ˆ 4 Statistics and Data Plots 555

User Manual
Page 633
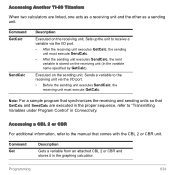
and select 8:Link. 2. Press ... Programming 633 Select a command. Accessing Another TI-89 Titanium, a CBL 2, or a CBR If you link a TI-89 Titanium to enter the commands in the Connectivity module), programs on the TI-89 Titanium can transmit variables between them. F3 I /O toolbar menu to a Calculator-Based Laboratory™ (CBL 2™) or a Calculator-Based Ranger™ (CBR™), a program on both units can access the CBL 2 or CBR. If you link two graphing calculators (described in this section. 1. I /O Toolbar Menu Use the Program Editor's ...
and select 8:Link. 2. Press ... Programming 633 Select a command. Accessing Another TI-89 Titanium, a CBL 2, or a CBR If you link a TI-89 Titanium to enter the commands in the Connectivity module), programs on the TI-89 Titanium can transmit variables between them. F3 I /O toolbar menu to a Calculator-Based Laboratory™ (CBL 2™) or a Calculator-Based Ranger™ (CBR™), a program on both units can access the CBL 2 or CBR. If you link two graphing calculators (described in this section. 1. I /O Toolbar Menu Use the Program Editor's ...
User Manual
Page 634
... attached CBL 2 or CBR and stores it in Connectivity. Command GetCalc SendCalc Description Executed on the sending unit. Executed on the receiving unit. Sets up the unit to "Transmitting Variables under Program Control" in the graphing calculator. Programming 634 Accessing Another TI-89 Titanium When two calculators are executed in the proper sequence, refer to receive...
... attached CBL 2 or CBR and stores it in Connectivity. Command GetCalc SendCalc Description Executed on the sending unit. Executed on the receiving unit. Sets up the unit to "Transmitting Variables under Program Control" in the graphing calculator. Programming 634 Accessing Another TI-89 Titanium When two calculators are executed in the proper sequence, refer to receive...
User Manual
Page 641
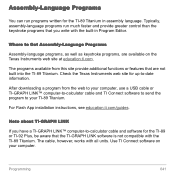
.... Use TI Connect software on the Texas Instruments web site at education.ti.com. For Flash App installation instructions, see education.ti.com/guides. Programming 641 Assembly-Language Programs You can run much faster and provide greater control than the keystroke programs that you have a TI-GRAPH LINK™ computer-to-calculator cable and software for the TI-89 or TI-92...
.... Use TI Connect software on the Texas Instruments web site at education.ti.com. For Flash App installation instructions, see education.ti.com/guides. Programming 641 Assembly-Language Programs You can run much faster and provide greater control than the keystroke programs that you have a TI-GRAPH LINK™ computer-to-calculator cable and software for the TI-89 or TI-92...

User Manual
Page 649
... session. Text Editor 649 Using a USB cable and TI Connect™ software with a space and a colon. For information about obtaining cables or updated TI Connect™ software, check the TI web site at education.ti.com, or contact Texas Instruments at the end of the screen. When you open... a previous session or return to the TI-89 Titanium. As you see an empty screen. Typing...
... session. Text Editor 649 Using a USB cable and TI Connect™ software with a space and a colon. For information about obtaining cables or updated TI Connect™ software, check the TI web site at education.ti.com, or contact Texas Instruments at the end of the screen. When you open... a previous session or return to the TI-89 Titanium. As you see an empty screen. Typing...

User Manual
Page 716
... up from the VAR-LINK screen. You can connect TI graphing calculators with this cable. Either unit can transmit information between two units. Connectivity 716 use the calculator's USB port with either type of each unit. A USB unit-to another TI-89 Titanium, Voyage™ 200, TI-89, or TI-92 Plus. Note: The TI-89 Titanium features both a USB port and an...
... up from the VAR-LINK screen. You can connect TI graphing calculators with this cable. Either unit can transmit information between two units. Connectivity 716 use the calculator's USB port with either type of each unit. A USB unit-to another TI-89 Titanium, Voyage™ 200, TI-89, or TI-92 Plus. Note: The TI-89 Titanium features both a USB port and an...

User Manual
Page 717
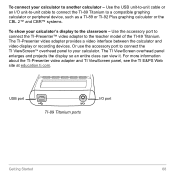
USB Port USB unit-to-unit cable USB Port Two TI-89 Titanium calculators linked together USB unit-to-unit cable Position so that the USB symbols face each other; then insert the connector. Connectivity 717
USB Port USB unit-to-unit cable USB Port Two TI-89 Titanium calculators linked together USB unit-to-unit cable Position so that the USB symbols face each other; then insert the connector. Connectivity 717

User Manual
Page 718
I/O Port I/O unit-to-unit cable I/O Port A TI-89 Titanium and a Voyage™ 200 linked together Connectivity 718
I/O Port I/O unit-to-unit cable I/O Port A TI-89 Titanium and a Voyage™ 200 linked together Connectivity 718

User Manual
Page 719
You can also transmit Flash applications (Apps) and folders. Connectivity 719 I/O Port I/O unit-to-unit cable TI-89 I/O Port A TI-89 Titanium and a TI-89 linked together Transmitting Variables, Flash Applications, and Folders Transmitting variables is a convenient way to share any variable listed on the VAR-LINK screen - functions, programs, etc.
You can also transmit Flash applications (Apps) and folders. Connectivity 719 I/O Port I/O unit-to-unit cable TI-89 I/O Port A TI-89 Titanium and a TI-89 linked together Transmitting Variables, Flash Applications, and Folders Transmitting variables is a convenient way to share any variable listed on the VAR-LINK screen - functions, programs, etc.

User Manual
Page 720
... the sending unit, select the variables, folders, or Flash applications you can transfer an App from a TI-89 Titanium to another TI-89 Titanium, or from a TI-89 Titanium to display the VAR-LINK screen. 3. Connect two graphing calculators using the appropriate cable. 2. Connectivity 720 If on the default VAR-LINK screen, this selects the folder and its contents. Setting...
... the sending unit, select the variables, folders, or Flash applications you can transfer an App from a TI-89 Titanium to another TI-89 Titanium, or from a TI-89 Titanium to display the VAR-LINK screen. 3. Connect two graphing calculators using the appropriate cable. 2. Connectivity 720 If on the default VAR-LINK screen, this selects the folder and its contents. Setting...


