

User Manual
Page 3
... Batteries 2 Turning On and Turning Off the TI-86 2 Adjusting the Contrast 2 Resetting All Memory and Defaults 3 Calculating on the Home Screen 3 Calculating the Sine of a Number 3 Storing the Last Answer to a Variable 3 Using a Variable in an Expression 4 Editing an Expression 4 Displaying a Complex Number as a Result 5 Using a List with a Function 5 Displaying the Integer Part of Real Numbers in a List 6 Removing (Exiting) a Menu 6 Finding the Square Root 7 Calculating Derivatives 7 Retrieving, Editing, and Re-evaluating the Previous Entry 8 Converting Degrees...
... Batteries 2 Turning On and Turning Off the TI-86 2 Adjusting the Contrast 2 Resetting All Memory and Defaults 3 Calculating on the Home Screen 3 Calculating the Sine of a Number 3 Storing the Last Answer to a Variable 3 Using a Variable in an Expression 4 Editing an Expression 4 Displaying a Complex Number as a Result 5 Using a List with a Function 5 Displaying the Integer Part of Real Numbers in a List 6 Removing (Exiting) a Menu 6 Finding the Square Root 7 Calculating Derivatives 7 Retrieving, Editing, and Re-evaluating the Previous Entry 8 Converting Degrees...
User Manual
Page 6
... Functions 80 Viewing and Changing OnàOff Status of Stat Plots 81 Setting the Window Variables 81 Displaying the Window Editor 82 Changing a Window Variable Value 82 Setting Graphing Accuracy with @x and @y 83 Setting the Graph Format 83 Displaying a Graph 85 Pausing or Stopping a Graph in Progress 85 Modifying a Drawn Graph 85 Graphing a Family of Curves 86 Smart Graph 86 Chapter 6: Graph Tools 87 Graph Tools on the TI-86 88 The GRAPH Menu 88 Using the Free-Moving Cursor 89 Graphing...
... Functions 80 Viewing and Changing OnàOff Status of Stat Plots 81 Setting the Window Variables 81 Displaying the Window Editor 82 Changing a Window Variable Value 82 Setting Graphing Accuracy with @x and @y 83 Setting the Graph Format 83 Displaying a Graph 85 Pausing or Stopping a Graph in Progress 85 Modifying a Drawn Graph 85 Graphing a Family of Curves 86 Smart Graph 86 Chapter 6: Graph Tools 87 Graph Tools on the TI-86 88 The GRAPH Menu 88 Using the Free-Moving Cursor 89 Graphing...

User Manual
Page 8
...Setting the Graph Screen Window Variables 127 Setting the Graph Format 128 Displaying the Graph 128 Using Graph Tools in Param Graphing Mode 128 The Free-Moving Cursor 128 Tracing a Parametric Function 128 Moving the Trace Cursor to a t Value 129 Using Zoom Operations 129 The GRAPH MATH Menu 130 Evaluating an Equation for a Specified t 130 Drawing on a Parametric Graph 130 Chapter 10: Differential Equation Graphing 131 Defining a Differential Equation Graph 132 Setting Differential Equation Graphing Mode 132 The GRAPH Menu 133 Setting the Graph Format 133 Displaying...
...Setting the Graph Screen Window Variables 127 Setting the Graph Format 128 Displaying the Graph 128 Using Graph Tools in Param Graphing Mode 128 The Free-Moving Cursor 128 Tracing a Parametric Function 128 Moving the Trace Cursor to a t Value 129 Using Zoom Operations 129 The GRAPH MATH Menu 130 Evaluating an Equation for a Specified t 130 Drawing on a Parametric Graph 130 Chapter 10: Differential Equation Graphing 131 Defining a Differential Equation Graph 132 Setting Differential Equation Graphing Mode 132 The GRAPH Menu 133 Setting the Graph Format 133 Displaying...

User Manual
Page 10
...Using Mathematical Functions with Matrices 185 Chapter 14: Statistics 187 Statistical Analysis on the TI-86 188 Setting Up a Statistical Analysis 188 The STAT (Statistics) Menu 188 Entering Statistical Data 189 The LIST NAMES Menu 189 The STAT CALC (Calculations) Menu 189 Automatic Regression Equation Storage 191 Results of a Statistical Analysis 192 The STAT VARS (Statistical Variables) Menu 192 Plotting Statistical Data 194 The STAT PLOT Status Screen 194 The STAT PLOT Menu 195 Setting Up a Stat Plot 195 Turning On and Turning Off a Stat Plot 195 The PLOT TYPE Menu...
...Using Mathematical Functions with Matrices 185 Chapter 14: Statistics 187 Statistical Analysis on the TI-86 188 Setting Up a Statistical Analysis 188 The STAT (Statistics) Menu 188 Entering Statistical Data 189 The LIST NAMES Menu 189 The STAT CALC (Calculations) Menu 189 Automatic Regression Equation Storage 191 Results of a Statistical Analysis 192 The STAT VARS (Statistical Variables) Menu 192 Plotting Statistical Data 194 The STAT PLOT Status Screen 194 The STAT PLOT Menu 195 Setting Up a Stat Plot 195 Turning On and Turning Off a Stat Plot 195 The PLOT TYPE Menu...
User Manual
Page 12
... Power Series 254 Reservoir Problem 256 Predator-Prey Model 258 Program: Sierpinski Triangle 260 Chapter 20: A to Z Function and Instruction Reference 261 Quick-Find Locator 262 Alphabetical Listing of Operations 266 Appendix 379 TI-86 Menu Map 380 Handling a Difficulty 392 Error Conditions 393 Equation Operating System (EOS 397 Implied Multiplication 397 Parentheses 397 TOL (The Tolerance Editor 398 Computational Accuracy 399 Support and Service Information 400 Product Support 400 Product Service...
... Power Series 254 Reservoir Problem 256 Predator-Prey Model 258 Program: Sierpinski Triangle 260 Chapter 20: A to Z Function and Instruction Reference 261 Quick-Find Locator 262 Alphabetical Listing of Operations 266 Appendix 379 TI-86 Menu Map 380 Handling a Difficulty 392 Error Conditions 393 Equation Operating System (EOS 397 Implied Multiplication 397 Parentheses 397 TOL (The Tolerance Editor 398 Computational Accuracy 399 Support and Service Information 400 Product Support 400 Product Service...

User Manual
Page 46
... displayed in scientific notation. Changing a Mode Setting ᕡ Move the cursor to the line of the setting that you want to change (decimal setting in the example). ᕢ Move the cursor to the setting you enter numbers. Mode settings control how the TI-86 displays and interprets numbers and graphs. The current settings are highlighted along the left of E and the appropriate power of 10 (which is always a multiple of the answer < .001, it is turned...
... displayed in scientific notation. Changing a Mode Setting ᕡ Move the cursor to the line of the setting that you want to change (decimal setting in the example). ᕢ Move the cursor to the setting you enter numbers. Mode settings control how the TI-86 displays and interprets numbers and graphs. The current settings are highlighted along the left of E and the appropriate power of 10 (which is always a multiple of the answer < .001, it is turned...

User Manual
Page 77
..., you can return this result using number base conversions. For example, in any number base using only a forward slash, as decimal. Chapter 4: Constants, Conversions, Bases, and Complex Numbers 65 To enter a forward slash ( à ), you can use the F key or paste it from the CATALOG. You also can enter numbers in Hex mode, 1à3+7 returns 7h (1 divided by 3, truncated to 0, and then added to an integer after every calculation and expression. For...
..., you can return this result using number base conversions. For example, in any number base using only a forward slash, as decimal. Chapter 4: Constants, Conversions, Bases, and Complex Numbers 65 To enter a forward slash ( à ), you can use the F key or paste it from the CATALOG. You also can enter numbers in Hex mode, 1à3+7 returns 7h (1 divided by 3, truncated to 0, and then added to an integer after every calculation and expression. For...
User Manual
Page 82
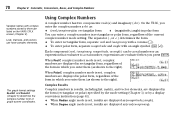
... of the form in rectangular or polar form, regardless of graph screen coordinates. The graph format settings RectGC and PolarGC (Chapter 5) determine the complex number form of the current complex number mode setting. When RectC complex number mode is set , complex numbers are evaluated when you enter the complex number a+bi as shown to the right). 70 Chapter 4: Constants, Conversions, Bases, and Complex Numbers Variable names with an angle symbol (- ). Using Complex Numbers A complex number has two components: real (a) and imaginary (+bi). Lists, matrices, and vectors...
... of the form in rectangular or polar form, regardless of graph screen coordinates. The graph format settings RectGC and PolarGC (Chapter 5) determine the complex number form of the current complex number mode setting. When RectC complex number mode is set , complex numbers are evaluated when you enter the complex number a+bi as shown to the right). 70 Chapter 4: Constants, Conversions, Bases, and Complex Numbers Variable names with an angle symbol (- ). Using Complex Numbers A complex number has two components: real (a) and imaginary (+bi). Lists, matrices, and vectors...

User Manual
Page 90
... point. ♦ You can edit expressions you include matrices, vectors, or complex values, the equation must evaluate to a non-real number, the value is returned. 78 Chapter 5: Function Graphing You can include another defined function in the program editor, select FnOn from the CATALOG (or enter the individual characters), enter the number of an equation variable, use the ALPHA keys, alpha keys, and other equations in the equation. ♦ If you inserted using...
... point. ♦ You can edit expressions you include matrices, vectors, or complex values, the equation must evaluate to a non-real number, the value is returned. 78 Chapter 5: Function Graphing You can include another defined function in the program editor, select FnOn from the CATALOG (or enter the individual characters), enter the number of an equation variable, use the ALPHA keys, alpha keys, and other equations in the equation. ♦ If you inserted using...
User Manual
Page 104
..., scatter plots, and stat plots only (Chapter 14) Uses window variable values stored in the user-defined zoom-window variables (ZSTO) Displays the ZOOM FACTORS screen Zooms out by factors of xFact only; adjusts window variable values in standard dimensions; adjusts xMin and xMax only; BOX ZIN ZOUT ZSTD ZPREV ZFIT ZSQR ZTRIG ZDECM ZDATA ZRCL ZFACT ZOOMX ZOOMY ZINT ZSTO Draws a box to display all statistical data points; the...
..., scatter plots, and stat plots only (Chapter 14) Uses window variable values stored in the user-defined zoom-window variables (ZSTO) Displays the ZOOM FACTORS screen Zooms out by factors of xFact only; adjusts window variable values in standard dimensions; adjusts xMin and xMax only; BOX ZIN ZOUT ZSTD ZPREV ZFIT ZSQR ZTRIG ZDECM ZDATA ZRCL ZFACT ZOOMX ZOOMY ZINT ZSTO Draws a box to display all statistical data points; the...

User Manual
Page 107
... menu. ♦ To execute a user-defined custom zoom, which resets the graph screen to the function. When a GRAPH MATH menu operation prompts you to specify left bound, right bound, and guess, the accuracy of time the TI-86 spends calculating the answer; The GRAPH MATH Menu 6 / & MATH DRAW FORMT STGDB RCGDB ROOT dyàdx ‰f(x) FMIN FMAX 4 INFLC YICPT ISECT DIST 4 TANLN ARC The zoom-window variables resume their standard default values...
... menu. ♦ To execute a user-defined custom zoom, which resets the graph screen to the function. When a GRAPH MATH menu operation prompts you to specify left bound, right bound, and guess, the accuracy of time the TI-86 spends calculating the answer; The GRAPH MATH Menu 6 / & MATH DRAW FORMT STGDB RCGDB ROOT dyàdx ‰f(x) FMIN FMAX 4 INFLC YICPT ISECT DIST 4 TANLN ARC The zoom-window variables resume their standard default values...
User Manual
Page 125
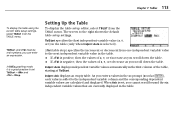
Chapter 7: Tables 113 To display the table using the current table setup settings, select TABLE from the TABLE menu. In DifEq graphing mode, it is a good practice to the right shows the default table setup settings. When Ask is positive, then the values of x, q, or t increase as you scroll down the table. ♦ If @Tbl is selected). @Tbl (table step) specifies the increment or decrement from one independent variable value to the...
Chapter 7: Tables 113 To display the table using the current table setup settings, select TABLE from the TABLE menu. In DifEq graphing mode, it is a good practice to the right shows the default table setup settings. When Ask is positive, then the values of x, q, or t increase as you scroll down the table. ♦ If @Tbl is selected). @Tbl (table step) specifies the increment or decrement from one independent variable value to the...

User Manual
Page 147
... memory is ¼ (thick) in DifEq mode. ♦ ¾ (shade above), ¿ (shade below), and  (dot) are available in Q'3, the calculator returns an error. The TI-86 graphs only those selected equations that are appropriate for the specified axes. ♦ The default graph style is available. For example, you can enter Q'1=t and Q'2=t2 and analyze each equation independently. Setting the Graph Screen Window Variables To display...
... memory is ¼ (thick) in DifEq mode. ♦ ¾ (shade above), ¿ (shade below), and  (dot) are available in Q'3, the calculator returns an error. The TI-86 graphs only those selected equations that are appropriate for the specified axes. ♦ The default graph style is available. For example, you can enter Q'1=t and Q'2=t2 and analyze each equation independently. Setting the Graph Screen Window Variables To display...

User Manual
Page 297
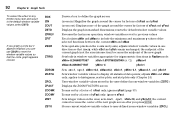
...: A to Z Function and Instruction Reference 285 DMS entry: ' degrees'minutes'seconds' MATH ANGLE menu In a trig calculation, the result of a DMS entry is in DMS format. DrawDot † graph format screen DrawDot Sets dot graphing format. 54'32'30' b 54.5416666667 In Degree angle mode: cos 54'32'30' b .580110760699 In Radian angle mode: cos 54'32'30' b L.422502666138 Do not use ¡ and " symbols to specify degrees and seconds. in Radian angle mode. Designates the entered angle is...
...: A to Z Function and Instruction Reference 285 DMS entry: ' degrees'minutes'seconds' MATH ANGLE menu In a trig calculation, the result of a DMS entry is in DMS format. DrawDot † graph format screen DrawDot Sets dot graphing format. 54'32'30' b 54.5416666667 In Degree angle mode: cos 54'32'30' b .580110760699 In Radian angle mode: cos 54'32'30' b L.422502666138 Do not use ¡ and " symbols to specify degrees and seconds. in Radian angle mode. Designates the entered angle is...

User Manual
Page 300
288 Chapter 20: A to Z Function and Instruction Reference DS
288 Chapter 20: A to Z Function and Instruction Reference DS

User Manual
Page 330
... complex number mode: log {L3,2} b {(.47712125472,1.364... [[6,12,18][5,14,31][3,8,18]] ¶MAT b [[6 12 18] [5 14 31] [3 8 18]] LU(MAT,L,U,P) b Done L b [[6 0 0] [5 4 0] [3 2 1]] U b [[1 2 3] [0 1 4] [0 0 1]] P b [[1 0 0] [0 1 0] [0 0 1]] lMatrixName ¹ uMatrixName = pMatrixName ¹ matrix log 2 b log (36.4/3) b .301029995664 1.08398012893 In RectC complex number mode: log (3,4) b (.698970004336,.4027... 318 Chapter 20: A to Z Function and Instruction Reference log < LU( MATRX MATH menu LnR Uses xStat, yStat, and fStat, and stores the regression equation...
... complex number mode: log {L3,2} b {(.47712125472,1.364... [[6,12,18][5,14,31][3,8,18]] ¶MAT b [[6 12 18] [5 14 31] [3 8 18]] LU(MAT,L,U,P) b Done L b [[6 0 0] [5 4 0] [3 2 1]] U b [[1 2 3] [0 1 4] [0 0 1]] P b [[1 0 0] [0 1 0] [0 0 1]] lMatrixName ¹ uMatrixName = pMatrixName ¹ matrix log 2 b log (36.4/3) b .301029995664 1.08398012893 In RectC complex number mode: log (3,4) b (.698970004336,.4027... 318 Chapter 20: A to Z Function and Instruction Reference log < LU( MATRX MATH menu LnR Uses xStat, yStat, and fStat, and stores the regression equation...
User Manual
Page 388
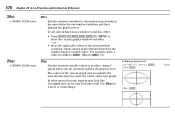
... graph screen. Use ZSqr for xMin to zxMin, yMin to the zoom-window variables, whose names begin with z followed by the regular window variable name. In other types of the new graph. In Func graphing mode: y1=‡(82Nx2):y2=Ly1 b ZStd b ZSqr b Done 376 Chapter 20: A to Z Function and Instruction Reference ZRcl † GRAPH ZOOM menu ZSqr † GRAPH ZOOM menu ZRcl Sets the window variables to store...
... graph screen. Use ZSqr for xMin to zxMin, yMin to the zoom-window variables, whose names begin with z followed by the regular window variable name. In other types of the new graph. In Func graphing mode: y1=‡(82Nx2):y2=Ly1 b ZStd b ZSqr b Done 376 Chapter 20: A to Z Function and Instruction Reference ZRcl † GRAPH ZOOM menu ZSqr † GRAPH ZOOM menu ZRcl Sets the window variables to store...

User Manual
Page 408
... the order. change field format or modify the order. ♦ You attempted to transmit item; try a larger value for the window variable difTol; The step size used by the fitting algorithm has become too small; check to see that references an undefined list. 396 Appendix 30 DIF EQ SETUP 31 DIF EQ MATH 32 POLY 33 TOL NOT MET 34 STAT PLOT 35...
... the order. change field format or modify the order. ♦ You attempted to transmit item; try a larger value for the window variable difTol; The step size used by the fitting algorithm has become too small; check to see that references an undefined list. 396 Appendix 30 DIF EQ SETUP 31 DIF EQ MATH 32 POLY 33 TOL NOT MET 34 STAT PLOT 35...
User Manual
Page 429
... coordinate mode), 36, 360 square (2), 360 square root (‡), 7, 360 St4Eq( (string to equation), 227, 361 STAT (statistical result variables), 43 STAT CALC (Calculations) menu, 189 STAT menu, 188 Stat Plot changing on/off status, 81 setting up, 195 turning on and off, 195 STAT PLOT menu, 195 STAT PLOT status screen, 194 STAT VARS (Statistical Variables) menu, 192 statistical analysis, 188 results, 192 statistical data entering, 189 plotting, 194, 195 STGDB (store graph database), 76, 88, 361 STOa, 210 STOb, 210 Stop, 219, 362 Store, 18 store symbol, 22 store...
... coordinate mode), 36, 360 square (2), 360 square root (‡), 7, 360 St4Eq( (string to equation), 227, 361 STAT (statistical result variables), 43 STAT CALC (Calculations) menu, 189 STAT menu, 188 Stat Plot changing on/off status, 81 setting up, 195 turning on and off, 195 STAT PLOT menu, 195 STAT PLOT status screen, 194 STAT VARS (Statistical Variables) menu, 192 statistical analysis, 188 results, 192 statistical data entering, 189 plotting, 194, 195 STGDB (store graph database), 76, 88, 361 STOa, 210 STOb, 210 Stop, 219, 362 Store, 18 store symbol, 22 store...

User Manual
Page 430
... storing results to, 3, 30 uppercase and lowercase names, 39 x variable, 77 y variable, 77 variable equations in a table, 114 VARS CPLX (complex variables) screen, 71 VARS EQU menu, 203 vc4li (vector to list), 160, 174, 369 vector, 29 brackets [ ], 369 complex, 171, 180 creating, 170 defined, 168 deleting from memory, 170 displaying, 171 editing dimension and elements, 172 forms, 168 operations, 173 using in an expression, 172 with math functions...
... storing results to, 3, 30 uppercase and lowercase names, 39 x variable, 77 y variable, 77 variable equations in a table, 114 VARS CPLX (complex variables) screen, 71 VARS EQU menu, 203 vc4li (vector to list), 160, 174, 369 vector, 29 brackets [ ], 369 complex, 171, 180 creating, 170 defined, 168 deleting from memory, 170 displaying, 171 editing dimension and elements, 172 forms, 168 operations, 173 using in an expression, 172 with math functions...


