Casio FX-CG10 Support Question
Casio FX-CG10 Support Question
Find answers below for this question about Casio FX-CG10.Need a Casio FX-CG10 manual? We have 2 online manuals for this item!
Question posted by Anonymous-118465 on August 17th, 2013
How To Graph Piecewise Functions On Fx Cg 10?
The person who posted this question about this Casio product did not include a detailed explanation. Please use the "Request More Information" button to the right if more details would help you to answer this question.
Current Answers
Answer #1: Posted by TommyKervz on August 17th, 2013 10:02 AM
TommyKervz

Member since:
January 10th, 2013 Points: 17,776,823

Member since:
January 10th, 2013 Points: 17,776,823
Greetings - The pdf resource on the link below may come in handy.
http://www.helpowl.com/manuals/Casio/FXCG10/147727
http://www.helpowl.com/manuals/Casio/FXCG10/147727
Related Casio FX-CG10 Manual Pages
Software User Guide - Page 4
...⇔ Text Conversion Table 8-59
9. Spreadsheet Basics and the Function Menu 9-1 2. Using the Memory Manager 11-1
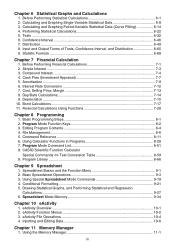
iii Chapter 6 Statistical Graphs and Calculations
1. Calculating and Graphing Paired-Variable Statistical Data (Curve Fitting 6-14 4. Confidence Interval ...6-46 7. Depreciation ...7-15 10. Bond Calculations ...7-17 11. Program Mode Command List 8-51 8. Program...
Software User Guide - Page 13

...You can show calculation results using Norm 1. Norm 1 10-2 (0.01) > |x|, |x| > 1010 Norm 2 10-9 (0.000000001) > |x|, |x| > 1010
All of characters, with the bottom line used for the function key menu. This...in 1.2 three places to 1.2 × 10¹². Text Screen
Graph Screen
k Normal Display
The calculator normally displays values up to 10 digits long. This results in the value 1,200,000,000,...
Software User Guide - Page 41

...}
u Sub Name (list naming)
• {On}/{Off} ... {display on}/{display off}
u Graph Func (function display during graph drawing and trace)
• {On}/{Off} ... {display on}/{display off}
u Dual Screen (dual screen mode status)
• {G+G}/{GtoT}/{Off} ... {graphing on both sides of dual screen}/{graph on one side and numeric table on the other side of...
Software User Guide - Page 73

... is the point for which you want to 10 calculation results can input a value or an expression as :
f
'
(a)
=
lim
Ax→0
-f-(-a-+-A-A-xx)----f-(-a-)
2-27 Example
To solve x2 - 5x - 6 = 0
K4(CALC)5(SolveN) vx-fv-g)w
J
k First Derivative Calculations
[OPTN]-[CALC]-[d/dx]
To perform first derivative calculations, first display the function analysis menu, and then input the values...
Software User Guide - Page 123

... to input values that Table mode column Y1 has been copied to the list. There are certain limitations on using the graphing functions of this calculator, you can use the numeric table generation functions in the Statistics mode
1. Press bw. 6. Enter the Statistics mode to confirm that result from the table to List 1.
3-16...
Software User Guide - Page 160

... = -10, Ymax = 10, Yscale = 2
1 m Statistics dwbw-bw
2 m Graph 3 !m(SET UP)cccc3(Off)J 4 !3(V-WIN)-fwfwbwc-ba
wbawcwJ 5 3(TYPE)1(Y=)!b(List)bvx-dw 6 6(DRAW)
• When multiple graphs are drawn simultaneously with the Y variable to the left of the expression are ignored. Example
Register {3, 1, −1} in the following V-Window settings. k Using Copy and Paste to Graph a Function...
Software User Guide - Page 161
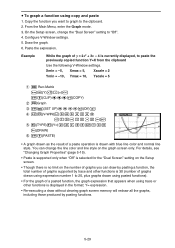
... is displayed in the format: Y= expression.
• Re-executing a draw without clearing graph screen memory will redraw all the graphs, including those produced by pasting functions.
5-29 Paste the expression. Xmin = -5, Xmax = 5, Xscale = 2 Ymin = -10, Ymax = 10, Yscale = 5
1 m Run-Matrix a-(Y)!.(=)v !i(CLIP)ddd1(COPY)
2 mGraph 3 !m(SET UP)cccc3(Off)J 4 !3(V-WIN)-fwfwcwc
-bawbawfwJ 5 3(TYPE...
Software User Guide - Page 187
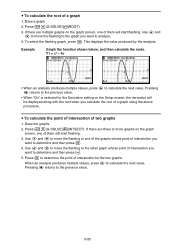
...). 3. If there are three or more graphs on the graph
screen, one of intersection for the Derivative setting on the graph screen, one of a graph using the above procedure. This displays the value produced by the analysis. Press w to calculate the next value. Example
Graph the function shown below, and then calculate the roots. When an analysis produces...
Software User Guide - Page 189
Example
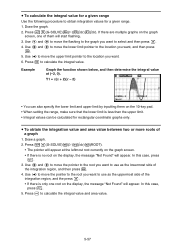
Graph the function shown below, and then determine the integral value at the leftmost root currently on the graph screen. • If there is no root on the 10-key pad. ...8226; If there is less than the upper limit. • Integral values can be calculated for rectangular coordinate graphs only. Draw the graph.
2. Press !5(G-SOLVE)6(g)3(∫dx)1(∫dx). Y1 = x(x + 2)(x - 2)...
Software User Guide - Page 216

...
In the explanations from the data input screen.
k Paired-Variable Statistical Calculations
In the previous example under "Displaying the Calculation Results of a Drawn Paired-Variable Graph", statistical calculation results were displayed after the graph was drawn. Pressing 2(CALC)3(REG) displays a function menu, which contains the following items.
• {ax+b}/{a+bx}/{Med}/{X2}/{X3...
Software User Guide - Page 219

... graph.
6-26
Press the keys as the result of ţ and xů when xi = 20 and yi = 1000
xi
10
...calculation. k Estimated Value Calculation ( , )
After drawing a regression graph with the Statistics mode, you can use the Run-Matrix mode
to the normal regression formula copy function that lets you copy the regression calculation result screen after drawing a statistical graph...
Software User Guide - Page 226
t Tests (page 6-36)
3(CHI) ... χ2 Test (page 6-39)
4(F) ... 2-Sample F Test (page 6-41)
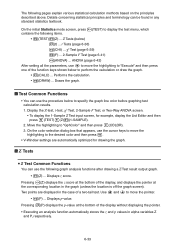
5(ANOVA) ... k Test Common Functions
• You can use the cursor keys to move the
highlighting to specify the graph line color before graphing test calculation results.
1. Display the Z-test, t-test, χ2 Test, 2-Sample F Test, or Two-Way ANOVA screen. • To display the...
Software User Guide - Page 229

...line 2. k t Tests
u t Test Common Functions
You can use the following key operation from the List Editor.
3(TEST) 1(Z) 4(2-PROP)
Calculation Result Output Example
p1>p2 direction of test •...the display without displaying the pointer. • Executing an analysis function automatically stores the t and p values in the graph (unless the location is applied to compare the proportion of a ...
Software User Guide - Page 232

... bottom of the display, and displays the pointer at the bottom of sample data fits a certain
distribution. Perform the following graph analysis functions after the calculation is finished.
• You cannot draw a graph for the [Resid List] item on the Setup screen, regression formula residual data is automatically saved to determine conformance with normal...
Software User Guide - Page 235
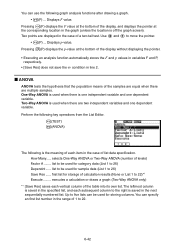
...there are two independent variables and one dependent variable. executes a calculation or draws a graph (Two-Way ANOVA only)
*1 [Save Res] saves each ...following graph analysis functions after drawing a graph.
• 1(F) ... Displays p-value. How Many..... first list for storing columns. Use d and e to 22.
6-42 Up to five lists can be used for storage of calculation ...
Software User Guide - Page 236

...appear when there is the average value of the function keys shown below to move between graphs by pressing f and c.
6-43 The Y-...calculation or draw the graph.
• 1(CALC) ... Error df value, SS value, MS value
Two-Way ANOVA
Line 1 (A Factor A df value, SS value, MS value, F value, p-value Line 2 (B Factor B df value, SS value, MS value, F value, p-value Line 3 (AB)........ Trace function...
Software User Guide - Page 404

...Graphs mode graph screen data
RUN
Graph Graph Editor Table Editor Conics Graph
Conic Graphs mode function list screen data Statistics mode statistical graph screen data
Conics Editor Stat Graph
Statistics mode List Editor data Equation mode calculation...
Econ Graph
Geometry mode screen data Picture Plot mode screen data
Geometry Picture Plot
10-17 See "Notes Notes Strips" on page 10-19 for...
Software User Guide - Page 406

... the strip.
Pressing w here again will graph the function you want to this Graph strip only. It is independent of data for an eActivity text line.
10-19 Press 6(DRAW). • This will display the graph screen, and draw the graph based on the workspace screen. Enter the function you entered.
10. You can call up the Notes...
Software User Guide - Page 521

... item is not displayed on plots
1. Perform the procedure under "To plot points on plotted coordinate values and draw a regression graph. Press K6(g)2(REG).
• This displays the regression calculation type function menu.
15-10
Note, however, that include variables can be modified by -one -by pressing K5(MODIFY) while the Picture Plot screen...
Software User Guide - Page 589

...the other types of this happens, shift the position the original graph to 10, and then press w. • The graph relation list appears with the calculation result.
7. Input a value in the range of 1 ...see Chapter 6 of regression.
20100801 Pressing 6(DRAW) here graphs the function. • This lets you press 6(DRAW) in step 7, the graph of the result of 1 to align it is overlaid....
Similar Questions

How To Draw Shaded Graph In Casio Fx-9750gii
(Posted by shotec 9 years ago)

How To Graph A Piecewise Function On A Casio Fx-9750gii
(Posted by TEE7kyya 9 years ago)

How To Graph Log Function On Casio Prizm?
How would you say graph log base 3 of x on Casio Prizm.
How would you say graph log base 3 of x on Casio Prizm.
(Posted by swagatbhattacharyya 9 years ago)

It Says 'invalid Setting' Whenever I Try To Graph Any Function.
I am not sure where or what I am supposed to change to make it work. I tried going into setup but i ...
I am not sure where or what I am supposed to change to make it work. I tried going into setup but i ...
(Posted by bieleckiandrzej 10 years ago)

Input Fraction
Hi, how do I input fraction to graph rational function? thanks
Hi, how do I input fraction to graph rational function? thanks
(Posted by markn775 11 years ago)