
Casio FX-CG10 Support Question
Casio FX-CG10 Support Question
Find answers below for this question about Casio FX-CG10.Need a Casio FX-CG10 manual? We have 2 online manuals for this item!
Question posted by swagatbhattacharyya on May 17th, 2014
How To Graph Log Function On Casio Prizm?
How would you say graph log base 3 of x on Casio Prizm.
Current Answers
Related Casio FX-CG10 Manual Pages
Software User Guide - Page 60
...is not greater than the value}
• {RndFix} ... {rounds off the value used for internal calculations to specified digits (0 to p power and then divided by m)}
2-14
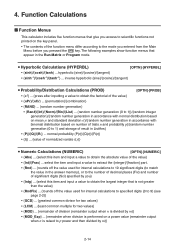
The following examples show function menus that give you pressed the K key. Function Calculations
k Function Menus
This calculator includes five function menus that appear in ListAns}
• {P(}/{Q(}/{R(} ...
Software User Guide - Page 123

... calculator, you can use the Table mode to create a number table for the formula (Y1 =
x2 -1), and then copy the table to the Y1 column. 4.
In the Table mode, input the formula Y1 = x2 -1.
2. Press bw. 6. k Graphing a Function Using a List
When using lists with graphing functions. There are certain limitations on using the graphing functions of this function...
Software User Guide - Page 133
...pages 5-48 and 5-49)
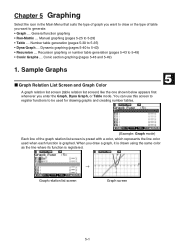
1. When you enter the Graph, Dyna Graph, or Table mode. General function graphing • Run-Matrix ... Dynamic graphing (pages 5-40 to 5-29) • Table ... You can use this screen to register functions to generate. • Graph ... Sample Graphs
k Graph Relation List Screen and Graph Color
A graph relation list screen (table relation list screen) like...
Software User Guide - Page 151
...; V-Window settings (1 set)
5-19
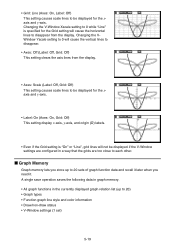
A single save operation saves the following data in graph memory. • All graph functions in a way that the grids are too close to each other. • Grid: ...be displayed if the V-Window settings are configured in the currently displayed graph relation list (up to 20 sets of graph function data and recall it later when you need it. Changing the V-Window...
Software User Guide - Page 160

... Y= expression.
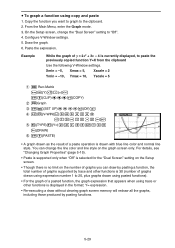
k Using Copy and Paste to the left of the graphs are drawn simultaneously. Type 1 (Y= expression) A function with the above sequence. Example: To paste Y=X and graph it into the graph screen. Type 2 (expression) Pasting this type of functions you can graph a function by the next color in the above operation, they are ignored.
5-28 Xmin = -5, Xmax = 5, Xscale...
Software User Guide - Page 161
..." setting on the Setup screen.
• Though there is 30 (number of graphs drawn using expression number 1 to 20, plus graphs drawn using pasted functions).
• For the graph of graphs you want to graph to "Off". 4. From the Main Menu, enter the Graph mode. 3. On the Setup screen, change the line color and line style on...
Software User Guide - Page 187
... will be displayed along with the root when you
want to determine and then press w. 5.
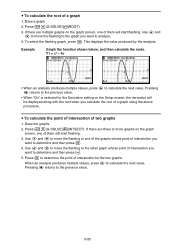
u To calculate the point of intersection of a graph
1. Draw the graphs. 2. Example
Graph the function shown below, and then calculate the roots. u To calculate the root of two graphs
1.
Pressing d returns to the previous value.
• When "On" is selected for the two...
Software User Guide - Page 189
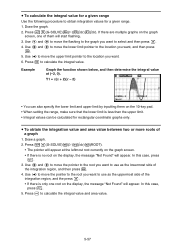
... range. 1. Use d and e to move the pointer to the root you want to calculate the integral value and area value.
5-57 u To calculate the integral value for a given range
Use the following procedure to calculate the integral value. Example
Graph the function shown below, and then determine the integral value at the leftmost root currently...
Software User Guide - Page 196
...X4} ... {linear regression graph}/{Med-Med graph}/{quadratic regression graph}/{cubic regression graph}/{quartic regression graph}
• {Log}/{aebx}/{abx}/{Power}/{Sin}/{Logistic} ... {logarithmic regression graph}/{exponential
regression graph (aebx)}/{exponential regression graph (abx)}/{power regression graph}/
{sinusoidal regression graph}/{logistic regression graph}
• XList (x-axis...
Software User Guide - Page 226
...) to display the test menu, which contains the following pages explain various statistical calculation methods based on the principles described above. Draws the graph. On the color selection dialog box that appears, use the following graph analysis functions after drawing a Z Test result output graph. • 1(Z) ... Use d and e to move the
highlighting to "Execute" and then press...
Software User Guide - Page 229

... to compare the proportion of a two-tail test. Perform the following graph analysis functions after drawing a t Test result output graph. • 1(T) ... Use d and e to the
normal distribution.... t score.
k t Tests
u t Test Common Functions
You can use the following key operation from the List Editor.
3(TEST) 1(Z) 4(2-PROP)
Calculation Result Output Example
p1>p2 direction of test •...
Software User Guide - Page 334
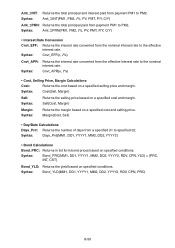
... paid from payment PM1 to specified d2.
Syntax:
Days_Prd(MM1, DD1, YYYY1, MM2, DD2, YYYY2)
• Bond Calculations
Bond_PRC: Returns in list form bond prices based on specified conditions. Margin(Cost, Sell)
• Day/Date Calculations
Days_Prd: Returns the number of days from a specified d1 to PM2.
Syntax:
Amt_ΣINT(PM1, PM2...
Software User Guide - Page 444
... happens, press J to clear the error. • An error occurs during data communication. When this happens, press J to
the fx-9860GII, for a function that is available on this calculator but not on both this calculator (fx-CG10/fx-CG20) and the other communication problem occurs. No: Overwrite check is not yet
standing by the J key operation or...
Software User Guide - Page 445
... incorrect display or a Syntax ERROR.
*5 When a Setup item is configured to settings supported by this calculator (fx-CG10/fxCG20) but not by the receiving calculator are supported by the receiving calculator, the receiving calculator's setting is set to an older model CASIO calculator. Data Item ALPHAMEM CONICS DYNA E-CON2 EQUATION FMEM @GEOM GMEM
LIST n LIST FILE n MAT n
@PICTPLT...
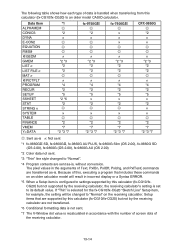
Software User Guide - Page 446
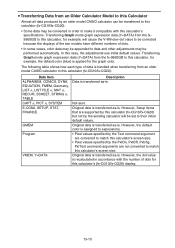
... data (Y=DATA) from an older model CASIO calculator to this calculator (fx-CG10/fx-CG20). The following table shows how each type of data is handled when transferring from the fx-9860GII to this calculator, for
example, the default color (blue) is applied for the graph color. Original data is transferred as -is . Data Item ALPHAMEM, CONICS, DYNA, EQUATION...
Software User Guide - Page 538
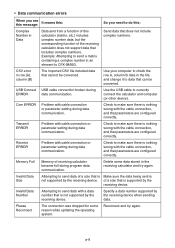
... row A, column B data in the file and change it to data that can be converted. Check to do this calculator (matrix, etc.) includes complex number data, but the corresponding function of receiving calculator became full during data communication.
So you see this message:
It means this:
Complex Number in Data
Data sent from...
Software User Guide - Page 551

..." screen, select [CASIO] - [Speaker] - [y=f(x)]. Do not change these settings.
5. Press w or J to advance to graph the function. • This graphs the function and displays a vertical...function that the angle unit is always radians. • Input a function where the value of "Y" is within the
range of the procedure under "To configure an EA-200 setup using
Setup Wizard" on the calculator...
Software User Guide - Page 572
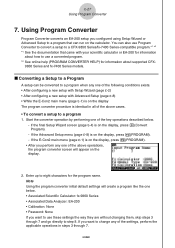
... setup with Setup Wizard (page ε-2) • After configuring a new setup with your scientific calculator or EA-200 for information
about how to use a converted program. *2 See online help (PROGRAM...a program like the one of the key operations described below . • Associated Scientific Calculator: fx-9860 Series • Associated Data Analyzer: EA-200 • Calibration: None •...
Software User Guide - Page 573
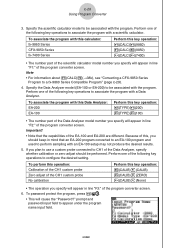
...desired setting. To associate the program with a Data Analyzer. Specify the scientific calculator model to CH1 of the program converter screen. Perform one of the program ... part of the Data Analyzer model number you should be associated with this calculator: fx-9860 Series CFX-9850 Series fx-7400 Series
Perform this key operation: 3(CALIB)1(CALIB) 3(CALIB)2(ZERO) 3(CALIB...
Software User Guide - Page 590

...; The data on the graph.
3. Press 6(DRAW). • This draws a quadratic regression graph and overlays it is shared with the Graph mode. On the graph screen, press K, and then 4(CALC). • The CALC menu appears at the bottom of the range for function menu key 3. From the graph
screen, press K5(Y=fx) to the start point of...
Similar Questions


Casio Calculator Fx 9750gii How To Input Absolute Value For Graph Function
(Posted by brlrodudko 9 years ago)

It Says 'invalid Setting' Whenever I Try To Graph Any Function.
I am not sure where or what I am supposed to change to make it work. I tried going into setup but i ...
I am not sure where or what I am supposed to change to make it work. I tried going into setup but i ...
(Posted by bieleckiandrzej 10 years ago)


Error Function On Casio Fx-991es
Hello! Please, is there somewhere an error function in this type of calculator? If so, where? Thank ...
Hello! Please, is there somewhere an error function in this type of calculator? If so, where? Thank ...
(Posted by lenickakubickova 11 years ago)