Quick Reference Guide
Page 2
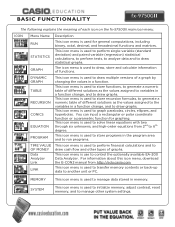
... a graph by changing the values in a function change , and to graph parabolas, circles, ellipses, and hyperbolas. BASIC FUNCTIONALITY fx-9"7Th5e0BGasIicIs" CASIO fx-9750GII The following explains the meaning of functions. This icon menu is used to store functions, to another unit or PC. This icon... to 6th degree. The icon menu is used to draw statistical graphs. This icon menu is used to perform single-variable (standard deviation) and paired variable (regression) statistical calculations, to perform tests, to analyze data and to solve linear equations with two through...
... a graph by changing the values in a function change , and to graph parabolas, circles, ellipses, and hyperbolas. BASIC FUNCTIONALITY fx-9"7Th5e0BGasIicIs" CASIO fx-9750GII The following explains the meaning of functions. This icon menu is used to store functions, to another unit or PC. This icon... to 6th degree. The icon menu is used to draw statistical graphs. This icon menu is used to perform single-variable (standard deviation) and paired variable (regression) statistical calculations, to perform tests, to analyze data and to solve linear equations with two through...


