Casio FX9750GII Support Question
Casio FX9750GII Support Question
Find answers below for this question about Casio FX9750GII - 0CALCULATOR GRAPHIC.Need a Casio FX9750GII manual? We have 1 online manual for this item!
Question posted by nanokk1112 on March 21st, 2012
How Do I Calculate The Mean And Standard Deviation Using Class Midpoints?
How do I calculate the mean and standard deviation estimates using the class mid points?
I went to STAT and put the class midpoint data into List 1, however I got the wrong answer I know I'm supposed to go to settings but then what do I do?
Current Answers
Related Casio FX9750GII Manual Pages
User Guide - Page 10
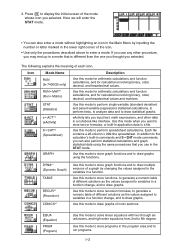
... 2nd to draw statistical graphs.
EQUA (Equation)
PRGM (Program)
Use this mode to perform single-variable (standard deviation) and paired-variable (regression) statistical calculations, to perform tests, to analyze data and to 6th degree.
Use this mode to store graph functions and to the variables in the STAT mode. Each file contains a 26-column × 999-line...
User Guide - Page 11
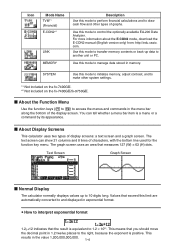
... to manage data stored in the menu bar along the bottom of characters, with the bottom line used for the function key menu. com. I About Display Screens
This calculator uses two types of graphs. This means that measures 127 (W) × 63 (H) dots.
The graph screen uses an area that you should move the decimal point in 1.2 twelve...
User Guide - Page 12
...° 34' 56.78"
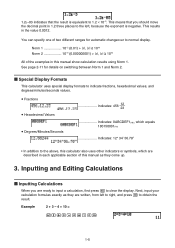
• In addition to the above, this manual show calculation results using Norm 1. This means that the result is negative. Norm 1 10-2 (0.01) > |x|, |x|
1010 ...Calculations
I Special Display Formats
This calculator uses special display formats to the left to right, and press U to clear the display. I Inputting Calculations
When you should move the decimal point...
User Guide - Page 30
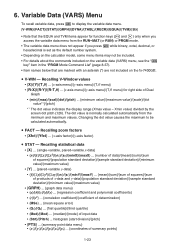
... • {Xfct}/{Yfct} ... {x-axis factor}/{y-axis factor}
S STAT - Recalling statistical data • {X} ... {single-variable, paired-variable x-data} • {n}/{x¯ }/{3x}/{3x2}/{Ʊx}/{sx}/{minX}/{maxX} ... {number of data}/{mean}/{sum}/{sum
of squares}/{population standard deviation}/{sample standard deviation}/{minimum value}/{maximum value}
• {Y} ... {paired-variable...
User Guide - Page 38

..., you should only use the RESTART button only as instructed. RESTART button
P button
fx-9860G SD fx-9860G fx-9860G AU PLUS
fx-9750G fx-7400G
fx-9860G SD fx-9860G
fx-9860G Slim
Important! I Restart and Reset
S Restart
Should the calculator start to their initial defaults.
If you edit a program, graph function, or other data in calculator memory and return all...
User Guide - Page 71
... on separate lines.
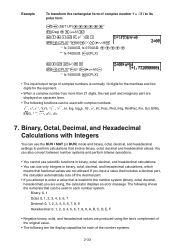
• The following functions can be used with Integers
You can use only integers in each of the number systems.
2-33 Example
To transform the rectangular form of complex number 1 + 3 i to its
polar form
K(SET UP)AAAAAA*
(Deg)A(a+bi))
@
V()B
*(CPLX)**(i)(E)(rQ)U * fx-7400GII, fx-9750GII: AAAAA ** fx-7400GII: (CPLX)
AT()E?
*(CPLX)*(E)(a+bi...
User Guide - Page 94
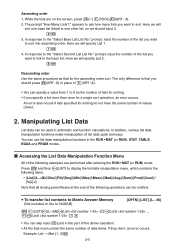
...function calculations. Manipulating List Data
List data can be used in place of the following examples are on the fx-7400GII)
[OPTN]-[LIST]-[LmM]
*(LIST)(LmM)(List)
(List) ...
(List) U
• You can use list data manipulation functions in the part of the above operation. • All the lists must contain the same number of list data quick and easy.
While the lists are...
User Guide - Page 144
... accumulated ratio.
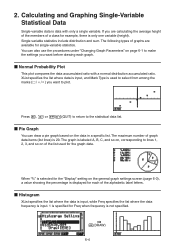
The maximum number of graphs are calculating the average height of the members of the list used to the statistical data list. I Normal Probability Plot
This plot compares the data accumulated ratio with only a single variable. 2. Calculating and Graphing Single-Variable Statistical Data
Single-variable data is not specified.
U(DRAW)
6-4 If you want before...
User Guide - Page 147
... below .
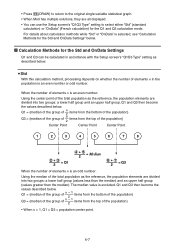
When the number of elements n is an even number or odd number. For details about calculation methods while "Std" or "OnData" is an even number:
Using the center point of
the
population}
• When n = 1, Q1 = Q3 = population center point.
6-7 The median value is excluded. Q1 and Q3 then become
the values described below .
User Guide - Page 154
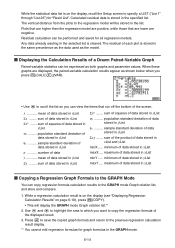
... standard deviation of data stored in the same precedence as the data used as shown below when you want to specify a LIST ("List 1" through "List 26") for all regression models. maximum of data
stored in xList
sx .......... sum of squares of
data stored in yList 3xy ........ population standard deviation of data stored in yList
I Displaying the Calculation Results of data...
User Guide - Page 155

The following is located before you can view variable characteristics. S To specify statistical calculation data lists
You have to perform and specify where it is the meaning for the calculation you want to input the statistical data for each item.
1Var XList ....... location of paired-variable statistic y values (YList)
2Var Freq........ location of single-variable frequency values...
User Guide - Page 161
...(STAT)(Var)
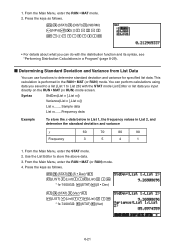
6-21 Syntax
StdDev(List n [,List m])
Variance(List n [,List m])
List n........Sample data
List m.......Frequency data
Example
To store the x-data below in List 1, the frequency values in the RUN • MAT (or RUN) mode. From the Main Menu, enter the RUN • MAT mode. 2. I Determining Standard Deviation and Variance from List Data
You can perform calculations using...
User Guide - Page 164
... the population standard deviation is applied to test the hypothesis. Displays z score. Two points are displayed in the case of the display, and displays the pointer at
the corresponding location in alpha variables Z
and P, respectively. Calculation Result Output Example
Mx11.4 .......... After setting all the parameters, use the following shows the parameter data specification items...
User Guide - Page 165
... Z Test is used when the standard deviations for Data: List setting.
sx2 Displayed only for an unknown proportion of test sx1 Displayed only for two populations are different from the statistical data list.
(TEST) (Z) (1-P)
6-25 Perform the following key operations from the statistical data list. (TEST) (Z) (2-S)
The following key operations from list data specification...
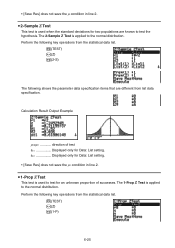
User Guide - Page 167
... from the statistical data list. (TEST) (t) (2-S)
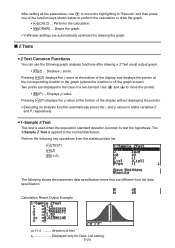
6-27 Pressing (P) displays the p-value at the bottom of test • [Save Res] does not save the M condition in alpha variables T
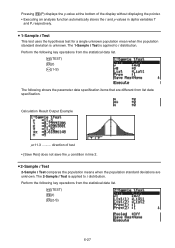
and P, respectively. S 1-Sample t Test
This test uses the hypothesis test for a single unknown population mean when the population
standard deviation is applied to t distribution. Calculation Result Output...
User Guide - Page 171
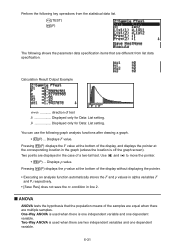
... used when there is used when there are two independent variables and one dependent variable. Two points are displayed in the case of the samples are equal when there are different from the statistical data list. (TEST) (F)
The following graph analysis functions after drawing a graph.
• (F) ... I ANOVA
ANOVA tests the hypothesis that are multiple samples. Calculation...
User Guide - Page 176
... for the difference between two
population means when the population standard deviations of successes. Perform the following key operations from the statistical data list.
(INTR) (Z) (1-P)
6-36 Perform the following key operations from the statistical data list.
(INTR) (Z) (2-S)
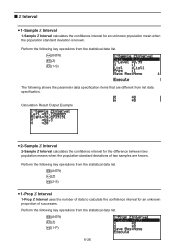
S 1-Prop Z Interval
1-Prop Z Interval uses the number of data to calculate the confidence interval for an...
User Guide - Page 177
...
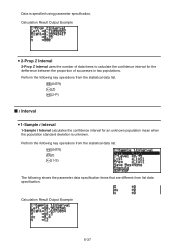
2-Prop Z Interval uses the number of data items to calculate the confidence interval for an unknown population mean when
the population standard deviation is specified using parameter specification. Perform the following key operations from the statistical data list.
(INTR) (t) (1-S)
The following key operations from list data specification.
Data is unknown. Calculation Result Output...
User Guide - Page 178
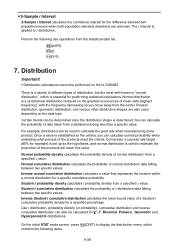
... falling between two specific values.
Normal cumulative distribution calculates the probability of t distribution data falling
between two specific values.
The t interval is essential for the difference between two population means when both population standard deviations are also used to t distribution. Poisson distribution, geometric distribution, and various other distribution...
User Guide - Page 191
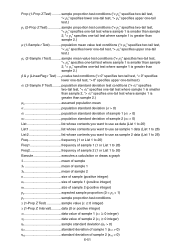
... population mean population standard deviation (Ʊ > 0) Ʊ1 population standard deviation of sample 1 (Ʊ1 > 0) Ʊ2 population standard deviation of sample 2 (Ʊ2 > 0)
List list whose contents you want to use as data (List 1 to 26)
List1 list whose contents you want to use as sample 1 data (List 1 to 26)
List 2 list whose contents you want to use as sample 2 data (List...
Similar Questions

How To Calculate Sample Standard Deviation On Fx-9750gii
(Posted by redmocape 9 years ago)

How To Calculate Standard Deviation Using Casio Fx-9750gii
(Posted by Jebcc214 9 years ago)
How To Calculate Standard Deviation On Casio Fx-9750gii
(Posted by generst 10 years ago)

How To Do Standard Deviation On Casio Fx-9750gii
(Posted by tkkakdea 10 years ago)
How To Do Standard Deviation On Fx-9750gii
(Posted by em21Raz 10 years ago)