Casio FX9750GII Support Question
Casio FX9750GII Support Question
Find answers below for this question about Casio FX9750GII - 0CALCULATOR GRAPHIC.Need a Casio FX9750GII manual? We have 1 online manual for this item!
Question posted by tkkakdea on November 8th, 2013
How To Do Standard Deviation On Casio Fx-9750gii
The person who posted this question about this Casio product did not include a detailed explanation. Please use the "Request More Information" button to the right if more details would help you to answer this question.
Current Answers
Related Casio FX9750GII Manual Pages
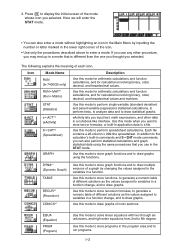
User Guide - Page 10
... (Recursion) CONICS*1
Use this mode to perform single-variable (standard deviation) and paired-variable (regression) statistical calculations, to perform tests, to analyze data and to draw graphs ...(fx-7400Gɉ only)
RUN • MAT*1 (Run • Matrix)
Description
Use this mode when you selected. Use this mode for arithmetic calculations and function calculations, and for calculations...
User Guide - Page 29
...
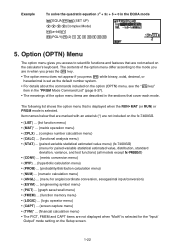
{menu for paired-variable statistical estimated value, distribution, standard
deviation, variance, and test functions} (all models except fx-7400Gɉ)
• {CONV} ... {metric conversion menu} • {HYP} ... {hyperbolic calculation menu} • {PROB} ... {probability/distribution calculation menu} • {NUM} ... {numeric calculation menu} • {ANGL} ... {menu for angle/coordinate...
User Guide - Page 30
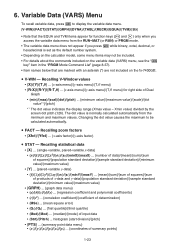
...fx-7400Gɉ. Recalling statistical data • {X} ... {single-variable, paired-variable x-data} • {n}/{x¯ }/{3x}/{3x2}/{Ʊx}/{sx}/{minX}/{maxX} ... {number of data}/{mean}/{sum}/{sum
of squares}/{population standard deviation}/{sample standard deviation... by the
screen dot pitch (126). The dot value is normally calculated automatically from the RUN • MAT (or RUN) or PRGM ...
User Guide - Page 31
...}/{size of sample 1}/{size of sample 2}/{mean of sample 1}/{mean of sample 2}/{standard deviation of sample 1}/{standard deviation of sample 2}/{standard
deviation of sample p} • {RESLT}* ... {statistical calculation output values}
• {TEST} ... {test calculation results}
• {p}/{z}/{t}/{Chi}/{F}/{ pˆ }/{ pˆ 1}/{ pˆ 2}/{df}/{se}/{r}/{r 2}/{pa}/{Fa}/{Adf}/{SSa...
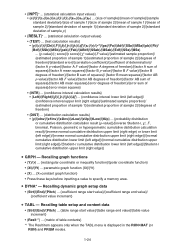
User Guide - Page 50
... value} • The {° ' "} menu operation is available only when there is a calculation result on a power value (remainder output
when n is raised to p power and then divided ...}/{random number generation in accordance with normal distribution based
on mean ƫ and standard deviation Ʊ}/{random number generation in accordance with binomial distribution based on number of trials...
User Guide - Page 54
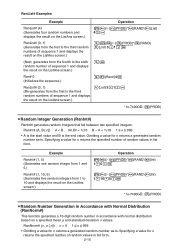
...returns the specified number of sequence 1 and displays the result on a specified mean ƫ and standard deviation Ʊ values.
Example
RanInt# (1, 5) (Generates one random integer from 1 and 5.)
RanInt#...RAND)(Int) 1
10
5U
* fx-7400GII: (PROB)
S Random Number Generation in Accordance with normal distribution
based on the ListAns screen.)
(List) 3
1U
* fx-7400GII: (PROB)
S ...
User Guide - Page 55
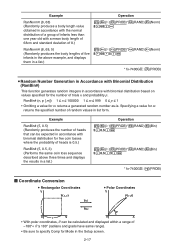
... 0.5) (Randomly produces the number of heads that can be calculated and displayed within a range of -180°< Ƨ...one year old with a mean body length of 68cm and standard deviation of 8.)
*(E)(PROB)*(RAND)(Norm) 8
68U
RanNorm# (8, ... displays them in a list.)
*(E)(PROB)*(RAND)(Norm) 8
68
5U
* fx-7400GII: (PROB)
S Random Number Generation in Accordance with Binomial Distribution ...
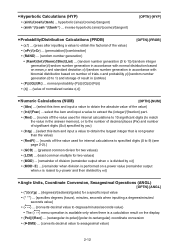
User Guide - Page 146
... is not specified.
x mean 3x sum 3x2 sum of squares
Sx population standard deviation
sx sample standard deviation
n number of data items
minX minimum
Q1 first quartile Med median Q3 third... you can be expressed as both graphs and parameter values.
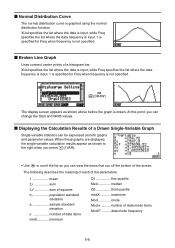
I Displaying the Calculation Results of the parameters. I Normal Distribution Curve
The normal distribution curve is ...
User Guide - Page 154
...).
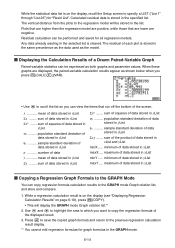
• Use A to the regression model will display the GRAPH mode Graph relation list.*1
2. population standard deviation of data stored in xList
sx .......... I Copying a Regression Graph Formula to the GRAPH Mode
You can copy regression formula calculation results to copy the regression formula of data stored in xList minY...... sum of squares of...
User Guide - Page 160
... for 160.5 cm)
(t() @FD DU (Normalized variate t for the data {1, 2, 3}, when the population standard deviation is S = 1.5 and
the population mean is ƫ = 2.
6-20 Input the probability value.
Input the commands to recall the probability calculation (PROB) menu.
(PROB)*(E)(t() @E? DU
* fx-7400GII: (PROB)
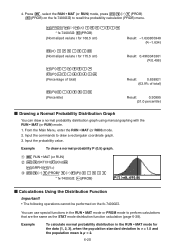
I Drawing a Normal Probability Distribution Graph
You can use special...
User Guide - Page 161
...). Press the keys as follows.
*(STAT)(S • Dev)*) (LIST)(List)@
(List)AU
* fx-7400GII: (STAT)(S • Dev)
)(STAT)(Var)*) (LIST)(List)@
(List)AU
* fx-7400GII: (STAT)(Var)
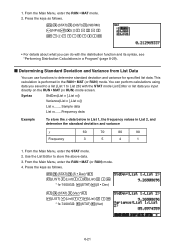
6-21
From the Main Menu, enter the STAT mode. 2. This calculation is performed in List 2, and
determine the standard deviation and variance
x
Frequency
60
70
80
90
3
5
4
1
1. From the Main...
User Guide - Page 162
... ƫ0*, assumed population mean ƫ0 = 0, population standard deviation Ʊ = 1, sample mean M = 1, number of different standardization-based tests. You can be performed repeatedly.
6-22 Tests
Important! • Test calculations cannot be performed on the fx-7400GII.
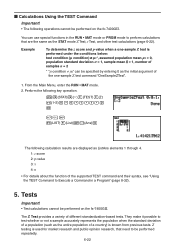
I Calculations Using the TEST Command
Important! • The following calculation results are the same as the...
User Guide - Page 163
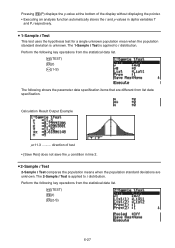
... explain various statistical calculation methods based on the quality and life of the hypothesis being proven is called the alternative hypothesis. On the initial STAT mode screen, press (TEST) to determine conformance with normal distribution or binomial distribution. 1-Sample Z Test tests for the unknown population mean when the
population standard deviation is unknown...
User Guide - Page 164
...
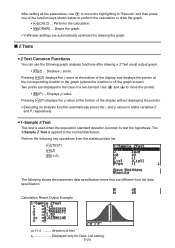
This test is used when the population standard deviation is applied to test the hypothesis. After setting all the parameters, use the following shows the parameter data specification items that are automatically optimized for Data: List setting. 6-24 Displays z score.
direction of a two-tail test. Calculation Result Output Example
Mx11.4 .......... The
1-Sample Z Test...
User Guide - Page 165
Calculation Result Output Example
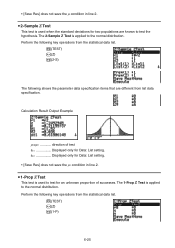
M1xM2 direction of successes. The 1-Prop Z Test is applied to the normal distribution. The 2-Sample Z Test... populations are different from the statistical data list.
(TEST) (Z) (1-P)
6-25 S 2-Sample Z Test
This test is used when the standard deviations for Data: List setting.
• [Save Res] does not save the M1 condition in line 2.
User Guide - Page 167
...list. (TEST) (t) (1-S)
The following key operations from list data specification. Calculation Result Output Example
Mx11.3 ..........
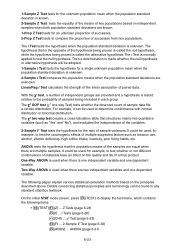
The 2-Sample t Test is applied to t ...1-Sample t Test
This test uses the hypothesis test for a single unknown population mean when the population
standard deviation is unknown. Pressing (P) displays the p-value at the bottom of test • [Save Res]...
User Guide - Page 175
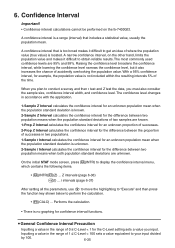
... unknown population mean when
the population standard deviation is too broad makes it difficult to obtain reliable results.
On the initial STAT mode screen, press (INTR) to perform the calculation.
• (CALC) ...
A narrow confidence interval, on the fx-7400GII. The most commonly used confidence levels are unknown.
Performs the calculation.
• There is no graphing...
User Guide - Page 178
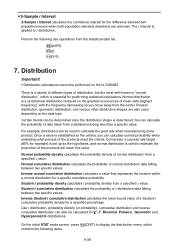
... with the frequency decreasing as you can be calculated for performing statistical calculations. For example, distribution can calculate normal probability when estimating what percent of the ... (80% for the difference between two population means when both population standard deviations are also used, depending on the fx-7400GII. There is a variety of different types of distribution, but ...
User Guide - Page 237
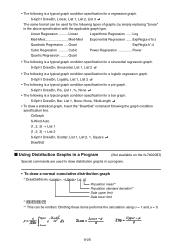
... Population standard deviation*1 Data upper limit Data lower limit
*1 This can be omitted. S-Gph1 DrawOn, Sinusoidal, List 1, List 2 =
• The following is a typical graph condition specification for a pie graph.
Quad
ExpReg(a·bˆx)
Cubic Regression .......... Cubic
Power Regression Power
Quartic Regression ........ Omitting these items performs the calculation...
User Guide - Page 314
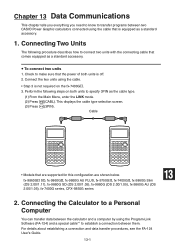
... to a Personal Computer
You can transfer data between the calculator and a computer by using the cable that comes equipped as a standard accessory. Connecting Two Units
The following steps on the fx-7400GII.
3. Perform the following procedure describes how to establish a connection between two CASIO Power Graphic calculators connected using the Program-Link Software (FA-124) and...
Similar Questions

How To Calculate Standard Deviation Using Casio Fx-9750gii
(Posted by Jebcc214 9 years ago)

How To Calculate Standard Deviation On Casio Fx-9750gii
(Posted by generst 10 years ago)

How To Find Population Standard Deviation Using Casio Fx-115es
(Posted by Bobsnts 10 years ago)

Standard Deviation Xon-1
Please advise I have a casio fx-991ES plus and need to calculate Standard deviation xon-1 is this po...
Please advise I have a casio fx-991ES plus and need to calculate Standard deviation xon-1 is this po...
(Posted by Anonymous-108196 11 years ago)

How Do I Calculate The Mean And Standard Deviation Using Class Midpoints?
How do I calculate the mean and standard deviation estimates using the class mid points? I went to ...
How do I calculate the mean and standard deviation estimates using the class mid points? I went to ...
(Posted by nanokk1112 12 years ago)