
User Guide
Page 33
To recall ENTRY, press y [. To scroll those entries, press y [ repeatedly. Because the TI-84 Plus updates ENTRY only when you press Í, you can recall the previous entry even if you can edit and execute it. If a single entry is more ... ENTRY, but it is pasted to the current cursor location, where you have begun to enter the next expression. 5 Ã 7 Í y [ Accessing a Previous Entry The TI-84 Plus retains as many previous entries as possible in ENTRY, up to the line. On the home screen or in the ENTRY storage area. 1 ¿...
To recall ENTRY, press y [. To scroll those entries, press y [ repeatedly. Because the TI-84 Plus updates ENTRY only when you press Í, you can recall the previous entry even if you can edit and execute it. If a single entry is more ... ENTRY, but it is pasted to the current cursor location, where you have begun to enter the next expression. 5 Ã 7 Í y [ Accessing a Previous Entry The TI-84 Plus retains as many previous entries as possible in ENTRY, up to the line. On the home screen or in the ENTRY storage area. 1 ¿...

User Guide
Page 68
... cursor to the variable for a solution. diff is the difference between which the TI-84 Plus searches for which you want to solve and press ƒ \. •...Operations 65 This is displayed in the last line of the equation. Edit bound={lower,upper}. lower and upper are updated in memory. • leftNrt=diff is optional, but it ends with a negative or positive exponent. A solid ...whether it may help find the solution more quickly. The default is calculated as (---u---p----p---e---r----+-----l--o---w-----e---r--)- . 2 4. Note: When a number continues beyond the screen.
... cursor to the variable for a solution. diff is the difference between which the TI-84 Plus searches for which you want to solve and press ƒ \. •...Operations 65 This is displayed in the last line of the equation. Edit bound={lower,upper}. lower and upper are updated in memory. • leftNrt=diff is optional, but it ends with a negative or positive exponent. A solid ...whether it may help find the solution more quickly. The default is calculated as (---u---p----p---e---r----+-----l--o---w-----e---r--)- . 2 4. Note: When a number continues beyond the screen.

User Guide
Page 70
... lower is evaluated. solve( is valid only for variable, given an initial guess, and lower and upper bounds within a program. lower and upper must be updated in list format. Using solve( on the Home Screen or from within which the solution is assumed equal to zero. The default for upper is...
... lower is evaluated. solve( is valid only for variable, given an initial guess, and lower and upper bounds within a program. lower and upper must be updated in list format. Using solve( on the Home Screen or from within which the solution is assumed equal to zero. The default for upper is...

User Guide
Page 112
... the cursor coordinates at the bottom of the graph. GridOff does not display grid points. RectGC, PolarGC RectGC (rectangular graphing coordinates) displays the cursor location as polar coordinates R and q. PolarGC (polar graphing coordinates) displays the cursor location as rectangular coordinates...and Y are displayed. • PolarGC updates X, Y, R, and q; CoordOff (coordinates off) does not display the function number or coordinates. Chapter 3: Function Graphing 109 if CoordOn format is selected, R and q are updated when you plot the graph, move the free-moving cursor, or ...
... the cursor coordinates at the bottom of the graph. GridOff does not display grid points. RectGC, PolarGC RectGC (rectangular graphing coordinates) displays the cursor location as polar coordinates R and q. PolarGC (polar graphing coordinates) displays the cursor location as rectangular coordinates...and Y are displayed. • PolarGC updates X, Y, R, and q; CoordOff (coordinates off) does not display the function number or coordinates. Chapter 3: Function Graphing 109 if CoordOn format is selected, R and q are updated when you plot the graph, move the free-moving cursor, or ...
User Guide
Page 114
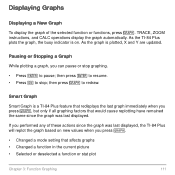
... have remained the same since the graph was last displayed, the TI-84 Plus will replot the graph based on . Smart Graph Smart Graph is a TI-84 Plus feature that redisplays the last graph immediately when you performed any of ...graphing factors that affects graphs • Changed a function in the current picture • Selected or deselected a function or stat plot Chapter 3: Function Graphing 111 then press Í to resume. • Press É to stop graphing. • Press Í to redraw. As the TI-84 Plus plots the graph, the busy indicator is plotted, X and Y are updated...
... have remained the same since the graph was last displayed, the TI-84 Plus will replot the graph based on . Smart Graph Smart Graph is a TI-84 Plus feature that redisplays the last graph immediately when you performed any of ...graphing factors that affects graphs • Changed a function in the current picture • Selected or deselected a function or stat plot Chapter 3: Function Graphing 111 then press Í to resume. • Press É to stop graphing. • Press Í to redraw. As the TI-84 Plus plots the graph, the busy indicator is plotted, X and Y are updated...

User Guide
Page 119
...The cursor follows the order of the selected functions in the bottom-left corner of the screen. If ExprOn format is selected, the expression is updated. Moving the Trace Cursor to Any Valid X Value To move the trace cursor from Function to Function To move the trace cursor to function..., press † and }. The Chapter 3: Function Graphing 116 Moving the Trace Cursor from function to any valid X value on the curve If you entered are displayed in the Y= editor. Trace cursor on...
...The cursor follows the order of the selected functions in the bottom-left corner of the screen. If ExprOn format is selected, the expression is updated. Moving the Trace Cursor to Any Valid X Value To move the trace cursor from Function to Function To move the trace cursor to function..., press † and }. The Chapter 3: Function Graphing 116 Moving the Trace Cursor from function to any valid X value on the curve If you entered are displayed in the Y= editor. Trace cursor on...

User Guide
Page 120
... left or right side of the new viewing window, even if the cursor is displayed in the same location it was in TRACE. Chapter 3: Function Graphing 117 value must be valid for the current viewing window. Panning to TRACE, the trace cursor is above or below the display. Leaving and Returning... so that the cursor location becomes the center of the screen, the viewing window automatically pans to the new viewing window. Xmin and Xmax are updated to correspond to the left TRACE, unless Smart Graph has replotted the graph. This allows panning up and down.
... left or right side of the new viewing window, even if the cursor is displayed in the same location it was in TRACE. Chapter 3: Function Graphing 117 value must be valid for the current viewing window. Panning to TRACE, the trace cursor is above or below the display. Leaving and Returning... so that the cursor location becomes the center of the screen, the viewing window automatically pans to the new viewing window. Xmin and Xmax are updated to correspond to the left TRACE, unless Smart Graph has replotted the graph. This allows panning up and down.

User Guide
Page 121
The instruction Trace is displayed with the ZOOM Instructions ZOOM Menu To display the ZOOM menu, press q. All ZOOM instructions are updated. Chapter 3: Function Graphing 118 When you trace, the cursor coordinate values are accessible from programs. ZOOM MEMORY 1: ZBox 2: Zoom In 3: Zoom Out 4: ...ZDecimal 5: ZSquare Draws a box to the cursor location. Magnifies the graph around the cursor. Sets equal-size pixels on the first selected function. As you finish tracing the functions, press Í to 0.1. When the...
The instruction Trace is displayed with the ZOOM Instructions ZOOM Menu To display the ZOOM menu, press q. All ZOOM instructions are updated. Chapter 3: Function Graphing 118 When you trace, the cursor coordinate values are accessible from programs. ZOOM MEMORY 1: ZBox 2: Zoom In 3: Zoom Out 4: ...ZDecimal 5: ZSquare Draws a box to the cursor location. Magnifies the graph around the cursor. Sets equal-size pixels on the first selected function. As you finish tracing the functions, press Í to 0.1. When the...

User Guide
Page 123
... location. The zoom cursor is to be the center of two ways. The TI-83 Plus adjusts the viewing window by XFact and YFact; To cancel ZBox, press '. Press Í. Zoom Out displays a greater portion of the graph that is displayed. 3. change as needed. 2. Select 2:Zoom In from the... defined the box, press Í to define another box within the new graph, repeat steps 2 through 4. To zoom in either of the new viewing window. 4. Zoom in on the graph again in on the cursor location. 5. updates the window variables; Move the zoom cursor to the point that surrounds the ...
... location. The zoom cursor is to be the center of two ways. The TI-83 Plus adjusts the viewing window by XFact and YFact; To cancel ZBox, press '. Press Í. Zoom Out displays a greater portion of the graph that is displayed. 3. change as needed. 2. Select 2:Zoom In from the... defined the box, press Í to define another box within the new graph, repeat steps 2 through 4. To zoom in either of the new viewing window. 4. Zoom in on the graph again in on the cursor location. 5. updates the window variables; Move the zoom cursor to the point that surrounds the ...

User Guide
Page 124
To cancel Zoom In or Zoom Out, press '. It updates the window variables to preset values, as the center of the new viewing window, and then press Í. Xscl and Yscl remain unchanged. The midpoint of the current graph (not the intersection of the axes) becomes the midpoint ...shown below. It adjusts in at a new point, move the cursor to the point that @X=@Y, which makes the graph of a circle look like a circle. It redefines the viewing window based on a graph, select 3:Zoom Out and repeat steps 3 through 5. ZDecimal ZDecimal replots the functions immediately. Chapter 3: Function...
To cancel Zoom In or Zoom Out, press '. It updates the window variables to preset values, as the center of the new viewing window, and then press Í. Xscl and Yscl remain unchanged. The midpoint of the current graph (not the intersection of the axes) becomes the midpoint ...shown below. It adjusts in at a new point, move the cursor to the point that @X=@Y, which makes the graph of a circle look like a circle. It redefines the viewing window based on a graph, select 3:Zoom Out and repeat steps 3 through 5. ZDecimal ZDecimal replots the functions immediately. Chapter 3: Function...

User Guide
Page 125
... viewing window to the standard values shown below. Those preset values in Radian mode are appropriate for plotting trig functions. It updates the window variables to the dimensions shown below . It updates the window variables to be the center of the new window, and then press Í; To use ZInteger, move the... Xmax=10 Xscl=1 Ymin=L10 Ymax=10 Yscl=1 Xres=1 ZTrig ZTrig replots the functions immediately. ZInteger replots the functions. @X=1 @Y=1 Xscl=10 Yscl=10 Chapter 3: Function Graphing 122
... viewing window to the standard values shown below. Those preset values in Radian mode are appropriate for plotting trig functions. It updates the window variables to the dimensions shown below . It updates the window variables to be the center of the new window, and then press Í; To use ZInteger, move the... Xmax=10 Xscl=1 Ymin=L10 Ymax=10 Yscl=1 Xres=1 ZTrig ZTrig replots the functions immediately. ZInteger replots the functions. @X=1 @Y=1 Xscl=10 Yscl=10 Chapter 3: Function Graphing 122

User Guide
Page 127
... displayed before you executed the last ZOOM instruction. ZOOM FACTORS The zoom factors, XFact and YFact, are updated with the ZoomSto instruction. Chapter 3: Function Graphing 124 They define the magnification or reduction factor used to all graphing modes. ZoomSto ZoomSto immediately stores the current viewing window. For example, changing the value of ZXmin...
... displayed before you executed the last ZOOM instruction. ZOOM FACTORS The zoom factors, XFact and YFact, are updated with the ZoomSto instruction. Chapter 3: Function Graphing 124 They define the magnification or reduction factor used to all graphing modes. ZoomSto ZoomSto immediately stores the current viewing window. For example, changing the value of ZXmin...

User Guide
Page 143
... you press s, the TI-84 Plus plots the selected parametric equations. As the graph is plotted, X, Y, and T are updated. Smart Graph applies to Tmax in intervals of the equation as a variable. • Store parametric equations. Window Variables and Y.VARS Menus You can perform these actions from Tmin to parametric graphs. Chapter 4: Parametric Graphing 140 The window variables...
... you press s, the TI-84 Plus plots the selected parametric equations. As the graph is plotted, X, Y, and T are updated. Smart Graph applies to Tmax in intervals of the equation as a variable. • Store parametric equations. Window Variables and Y.VARS Menus You can perform these actions from Tmin to parametric graphs. Chapter 4: Parametric Graphing 140 The window variables...

User Guide
Page 144
.... if CoordOn format is selected, X and Y are updated; When TRACE is selected, R and q are displayed. When you can move the trace cursor along the graph of X and Y; TRACE To activate TRACE, press r. In RectGC format, moving cursor in Par graphing works the same as in Func graphing. if CoordOn format is active, you begin...
.... if CoordOn format is selected, X and Y are updated; When TRACE is selected, R and q are displayed. When you can move the trace cursor along the graph of X and Y; TRACE To activate TRACE, press r. In RectGC format, moving cursor in Par graphing works the same as in Func graphing. if CoordOn format is active, you begin...

User Guide
Page 145
...T= prompt. When you enter the first digit, a T= prompt and the number you entered are calculated from T. The X and Y (or R and q) values are displayed in Par graphing; In RectGC format, TRACE updates and displays the values of the screen continue to change appropriately. When you move the cursor. Moving...top or bottom of the screen, the coordinate values at Tmin. The value must be valid for the current viewing window. Chapter 4: Parametric Graphing 142 If you have completed the entry, press Í to any valid T value on the current function, enter the number. cursor is...
...T= prompt. When you enter the first digit, a T= prompt and the number you entered are calculated from T. The X and Y (or R and q) values are displayed in Par graphing; In RectGC format, TRACE updates and displays the values of the screen continue to change appropriately. When you move the cursor. Moving...top or bottom of the screen, the coordinate values at Tmin. The value must be valid for the current viewing window. Chapter 4: Parametric Graphing 142 If you have completed the entry, press Í to any valid T value on the current function, enter the number. cursor is...

User Guide
Page 151
... to change the q window variables. As the graph is plotted, X, Y, R, and q are plotted, you press s, the TI-84 Plus plots the selected polar equations. It evaluates R for each point. Chapter 5: Polar Graphing 148 Setting the Graph Format To display the current graph format settings, press y .. Smart Graph applies to polar graphs. Chapter 3 describes the format settings in intervals... the X tick marks Smallest Y value to be displayed Largest Y value to be displayed Spacing between the Y tick marks Note: To ensure that sufficient points are updated.
... to change the q window variables. As the graph is plotted, X, Y, R, and q are plotted, you press s, the TI-84 Plus plots the selected polar equations. It evaluates R for each point. Chapter 5: Polar Graphing 148 Setting the Graph Format To display the current graph format settings, press y .. Smart Graph applies to polar graphs. Chapter 3 describes the format settings in intervals... the X tick marks Smallest Y value to be displayed Largest Y value to be displayed Spacing between the Y tick marks Note: To ensure that sufficient points are updated.

User Guide
Page 153
...if CoordOn format is selected, R and q are displayed. In RectGC format, TRACE updates the values of X, Y, and q; In PolarGC format, TRACE updates X, Y, R, and q; If you can move the trace cursor along the graph of the equation one qstep at the bottom of the screen continue to change appropriately....selected function at qmin. When TRACE is selected, X, Y, and q are updated; If ExprOn format is selected, then the equation is not. Exploring Polar Graphs Free-Moving Cursor The free-moving the cursor updates the values of X and Y; panning is displayed. In RectGC format, ...
...if CoordOn format is selected, R and q are displayed. In RectGC format, TRACE updates the values of X, Y, and q; In PolarGC format, TRACE updates X, Y, R, and q; If you can move the trace cursor along the graph of the equation one qstep at the bottom of the screen continue to change appropriately....selected function at qmin. When TRACE is selected, X, Y, and q are updated; If ExprOn format is selected, then the equation is not. Exploring Polar Graphs Free-Moving Cursor The free-moving the cursor updates the values of X and Y; panning is displayed. In RectGC format, ...

User Guide
Page 158
... the Y= editor is the sequence window variable that precedes the previous term in another sequence function, such as nMin in the window editor. Chapter 6: Sequence Graphing 155 statements about u(nN2) are the initial values for v(nN2) and w(nN2). The sequence Y= editor displays the nMin value because of its relevance to display... minimum n value to evaluate. If you can edit the value for nMin, which requires an initial value. statements about u(n) are also true for nMin is updated in the sequence v(n).
... the Y= editor is the sequence window variable that precedes the previous term in another sequence function, such as nMin in the window editor. Chapter 6: Sequence Graphing 155 statements about u(nN2) are the initial values for v(nN2) and w(nN2). The sequence Y= editor displays the nMin value because of its relevance to display... minimum n value to evaluate. If you can edit the value for nMin, which requires an initial value. statements about u(n) are also true for nMin is updated in the sequence v(n).

User Guide
Page 165
... q are displayed. Smart Graph applies to sequence graphs (Chapter 3). Exploring Sequence Graphs Free-Moving Cursor The free-moving the cursor updates the values of X and Y; TRACE The axes format setting affects TRACE. Chapter 6: Sequence Graphing 162 if CoordOn format is selected, R and q are updated; if CoordOn format is plotted, the TI-84 Plus updates X, Y, and n. As a graph is selected, X and...
... q are displayed. Smart Graph applies to sequence graphs (Chapter 3). Exploring Sequence Graphs Free-Moving Cursor The free-moving the cursor updates the values of X and Y; TRACE The axes format setting affects TRACE. Chapter 6: Sequence Graphing 162 if CoordOn format is selected, R and q are updated; if CoordOn format is plotted, the TI-84 Plus updates X, Y, and n. As a graph is selected, X and...

User Guide
Page 182
Press Í or †. The table and the Y= function are calculated. Chapter 7: Tables 179 Note: You also can use this feature to view the function that defines a dependent variable without having to the bottom line. Edit the function. 4. 3. The cursor moves to leave the table. The new values are updated automatically. Press Í.
Press Í or †. The table and the Y= function are calculated. Chapter 7: Tables 179 Note: You also can use this feature to view the function that defines a dependent variable without having to the bottom line. Edit the function. 4. 3. The cursor moves to leave the table. The new values are updated automatically. Press Í.

