User Manual
Page 1
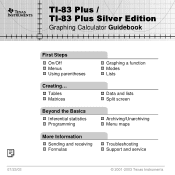
TI TI-83 Plus / TI-83 Plus Silver Edition Graphing Calculator Guidebook 07/23/03 First Steps On/Off Menus Using parentheses Creating... Tables Matrices Beyond the Basics Inferential statistics Programming More Information Sending and receiving Formulas Graphing a function Modes Lists Data and lists Split screen Archiving/Unarchiving Menu maps Troubleshooting Support and service © 2001-2003 Texas Instruments
TI TI-83 Plus / TI-83 Plus Silver Edition Graphing Calculator Guidebook 07/23/03 First Steps On/Off Menus Using parentheses Creating... Tables Matrices Beyond the Basics Inferential statistics Programming More Information Sending and receiving Formulas Graphing a function Modes Lists Data and lists Split screen Archiving/Unarchiving Menu maps Troubleshooting Support and service © 2001-2003 Texas Instruments
User Manual
Page 5
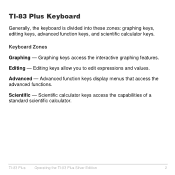
Advanced - TI-83 Plus Operating the TI-83 Plus Silver Edition 2 Keyboard Zones Graphing - Scientific calculator keys access the capabilities of a standard scientific calculator. Editing keys allow you to edit expressions and values. Advanced function keys display menus that access the advanced functions. Graphing keys access the interactive graphing features. Editing - TI-83 Plus Keyboard Generally, the keyboard is divided into these zones: graphing keys, editing keys, advanced function keys, and scientific calculator keys. Scientific -
Advanced - TI-83 Plus Operating the TI-83 Plus Silver Edition 2 Keyboard Zones Graphing - Scientific calculator keys access the capabilities of a standard scientific calculator. Editing keys allow you to edit expressions and values. Advanced function keys display menus that access the advanced functions. Graphing keys access the interactive graphing features. Editing - TI-83 Plus Keyboard Generally, the keyboard is divided into these zones: graphing keys, editing keys, advanced function keys, and scientific calculator keys. Scientific -
User Manual
Page 6
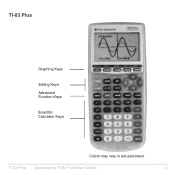
TI-83 Plus Graphing Keys Editing Keys Advanced Function Keys Scientific Calculator Keys Colors may vary in actual product. TI-83 Plus Operating the TI-83 Plus Silver Edition 3
TI-83 Plus Graphing Keys Editing Keys Advanced Function Keys Scientific Calculator Keys Colors may vary in actual product. TI-83 Plus Operating the TI-83 Plus Silver Edition 3
User Manual
Page 7
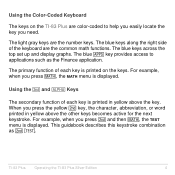
The blue keys across the top set up and display graphs. The primary function of each key is printed on the TI-83 Plus are the number keys. The blue Œ key provides access to help you easily locate the key you press , the MATH menu is displayed.... keys becomes active for the next keystroke. Using the y and ƒ Keys The secondary function of the keyboard are the common math functions. TI-83 Plus Operating the TI-83 Plus Silver Edition 4 Using the Color.Coded Keyboard The keys on the keys. The blue keys along the right side of each key is printed in yellow...
The blue keys across the top set up and display graphs. The primary function of each key is printed on the TI-83 Plus are the number keys. The blue Œ key provides access to help you easily locate the key you press , the MATH menu is displayed.... keys becomes active for the next keystroke. Using the y and ƒ Keys The secondary function of the keyboard are the common math functions. TI-83 Plus Operating the TI-83 Plus Silver Edition 4 Using the Color.Coded Keyboard The keys on the keys. The blue keys along the right side of each key is printed in yellow...
User Manual
Page 13
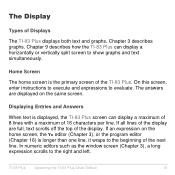
.... In numeric editors such as the window screen (Chapter 3), a long expression scrolls to the beginning of the next line. TI-83 Plus Operating the TI-83 Plus Silver Edition 10 If all lines of the display are displayed on the home screen, the Y= editor (Chapter 3), or the program editor.... On this screen, enter instructions to execute and expressions to show graphs and text simultaneously. Chapter 3 describes graphs. Chapter 9 describes how the TI-83 Plus can display a maximum of 8 lines with a maximum of the TI-83 Plus. The answers are full, text scrolls off the top of Displays ...
.... In numeric editors such as the window screen (Chapter 3), a long expression scrolls to the beginning of the next line. TI-83 Plus Operating the TI-83 Plus Silver Edition 10 If all lines of the display are displayed on the home screen, the Y= editor (Chapter 3), or the program editor.... On this screen, enter instructions to execute and expressions to show graphs and text simultaneously. Chapter 3 describes graphs. Chapter 9 describes how the TI-83 Plus can display a maximum of 8 lines with a maximum of the TI-83 Plus. The answers are full, text scrolls off the top of Displays ...
User Manual
Page 14
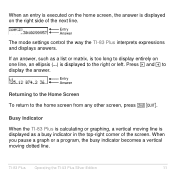
... from any other screen, press y 5. TI-83 Plus Operating the TI-83 Plus Silver Edition 11 Entry Answer Returning to the Home Screen To return to display the answer. If an answer, such as a busy indicator in the top-right corner of the next line. Busy Indicator When the TI-83 Plus is calculating or graphing, a vertical moving dotted line. Entry...
... from any other screen, press y 5. TI-83 Plus Operating the TI-83 Plus Silver Edition 11 Entry Answer Returning to the Home Screen To return to display the answer. If an answer, such as a busy indicator in the top-right corner of the next line. Busy Indicator When the TI-83 Plus is calculating or graphing, a vertical moving dotted line. Entry...
User Manual
Page 15
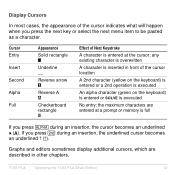
... item to be pasted as a character. any existing character is overwritten A character is inserted in other chapters. Graphs and editors sometimes display additional cursors, which are entered at the cursor; TI-83 Plus Operating the TI-83 Plus Silver Edition 12 Display Cursors In most cases, the appearance of the cursor indicates what will happen when you press...
... item to be pasted as a character. any existing character is overwritten A character is inserted in other chapters. Graphs and editors sometimes display additional cursors, which are entered at the cursor; TI-83 Plus Operating the TI-83 Plus Silver Edition 12 Display Cursors In most cases, the appearance of the cursor indicates what will happen when you press...
User Manual
Page 19
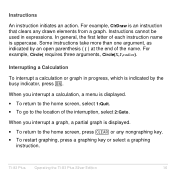
... home screen, select 1:Quit. • To go to the home screen, press ' or any drawn elements from a graph. Instructions An instruction initiates an action. When you interrupt a calculation, a menu is uppercase. Some instructions take more than ...a Calculation To interrupt a calculation or graph in expressions. Instructions cannot be used in progress, which is an instruction that clears any nongraphing key. • To restart graphing, press a graphing key or select a graphing instruction. TI-83 Plus Operating the TI-83 Plus Silver Edition 16 For example, ClrDraw is indicated...
... home screen, select 1:Quit. • To go to the home screen, press ' or any drawn elements from a graph. Instructions An instruction initiates an action. When you interrupt a calculation, a menu is uppercase. Some instructions take more than ...a Calculation To interrupt a calculation or graph in expressions. Instructions cannot be used in progress, which is an instruction that clears any nongraphing key. • To restart graphing, press a graphing key or select a graphing instruction. TI-83 Plus Operating the TI-83 Plus Silver Edition 16 For example, ClrDraw is indicated...
User Manual
Page 22
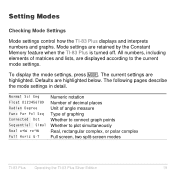
... of graphing Whether to connect graph points Whether to the current mode settings. Setting Modes Checking Mode Settings Mode settings control how the TI-83 Plus displays and interprets numbers and graphs. Mode settings are displayed according to plot simultaneously Real, rectangular complex, or polar complex Full screen, two split-screen modes TI-83 Plus Operating the TI-83 Plus Silver Edition 19...
... of graphing Whether to connect graph points Whether to the current mode settings. Setting Modes Checking Mode Settings Mode settings control how the TI-83 Plus displays and interprets numbers and graphs. Mode settings are displayed according to plot simultaneously Real, rectangular complex, or polar complex Full screen, two split-screen modes TI-83 Plus Operating the TI-83 Plus Silver Edition 19...

User Manual
Page 25
... values as radians. Answers display in radians. Answers display in degrees. TI-83 Plus Operating the TI-83 Plus Silver Edition 22 Radian mode interprets angle values as degrees. The decimal setting applies to these numbers: • An answer displayed on the home screen • Coordinates on a graph (Chapters 3, 4, 5, and 6) • The Tangent( DRAW instruction equation of the...
... values as radians. Answers display in radians. Answers display in degrees. TI-83 Plus Operating the TI-83 Plus Silver Edition 22 Radian mode interprets angle values as degrees. The decimal setting applies to these numbers: • An answer displayed on the home screen • Coordinates on a graph (Chapters 3, 4, 5, and 6) • The Tangent( DRAW instruction equation of the...

User Manual
Page 26
... the calculated points of X (Chapter 3). TI-83 Plus Operating the TI-83 Plus Silver Edition 23 Chapters 3, 4, 5, and 6 describe these modes in detail. Pol (polar) graphing mode plots functions, where r is a function of the selected functions. Seq (sequence) graphing mode plots sequences (Chapter 6). Func, Par, Pol, Seq Graphing modes define the graphing parameters. Par (parametric) graphing mode plots relations, where X and Y are...
... the calculated points of X (Chapter 3). TI-83 Plus Operating the TI-83 Plus Silver Edition 23 Chapters 3, 4, 5, and 6 describe these modes in detail. Pol (polar) graphing mode plots functions, where r is a function of the selected functions. Seq (sequence) graphing mode plots sequences (Chapter 6). Func, Par, Pol, Seq Graphing modes define the graphing parameters. Par (parametric) graphing mode plots relations, where X and Y are...

User Manual
Page 27
TI-83 Plus Operating the TI-83 Plus Silver Edition 24 Real, a+bi, re^qi Real mode does not display complex results unless complex numbers are entered as input. Two complex modes display complex results. &#... (polar complex mode) displays complex numbers in the form re^qi. Note: Regardless of X. Simul (simultaneous) graphing-order mode evaluates and plots all stat plots before the next function is selected, the TI-83 Plus will sequentially graph all selected functions for a single value of X and then evaluates and plots them for the next value...
TI-83 Plus Operating the TI-83 Plus Silver Edition 24 Real, a+bi, re^qi Real mode does not display complex results unless complex numbers are entered as input. Two complex modes display complex results. &#... (polar complex mode) displays complex numbers in the form re^qi. Note: Regardless of X. Simul (simultaneous) graphing-order mode evaluates and plots all stat plots before the next function is selected, the TI-83 Plus will sequentially graph all selected functions for a single value of X and then evaluates and plots them for the next value...

User Manual
Page 28
TI-83 Plus Operating the TI-83 Plus Silver Edition 25 it displays the home screen or an editor on the bottom half (Chapter 9). • G.T (graph-table) mode displays the current graph on the left half of the screen; Each split-screen mode displays two screens simultaneously. • Horiz (horizontal) mode displays the current graph on the right half (Chapter 9). it displays the table screen on the top half of the screen; Full, Horiz, G.T Full screen mode uses the entire screen to display a graph or edit screen.
TI-83 Plus Operating the TI-83 Plus Silver Edition 25 it displays the home screen or an editor on the bottom half (Chapter 9). • G.T (graph-table) mode displays the current graph on the left half of the screen; Each split-screen mode displays two screens simultaneously. • Horiz (horizontal) mode displays the current graph on the right half (Chapter 9). it displays the table screen on the top half of the screen; Full, Horiz, G.T Full screen mode uses the entire screen to display a graph or edit screen.
User Manual
Page 29
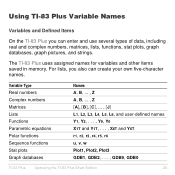
... plots Graph databases Names A, B, ... , Z A, B, ... , Z ãAä, ãBä, ãCä, ... , ãJä L1, L2, L3, L4, L5, L6, and user-defined names Y1, Y2, . . . , Y9, Y0 X1T and Y1T, . . . , X6T and Y6T r1, r2, r3, r4, r5, r6 u, v, w Plot1, Plot2, Plot3 GDB1, GDB2, . . . , GDB9, GDB0 TI-83 Plus Operating the TI-83 Plus Silver Edition 26 The TI-83 Plus uses...
... plots Graph databases Names A, B, ... , Z A, B, ... , Z ãAä, ãBä, ãCä, ... , ãJä L1, L2, L3, L4, L5, L6, and user-defined names Y1, Y2, . . . , Y9, Y0 X1T and Y1T, . . . , X6T and Y6T r1, r2, r3, r4, r5, r6 u, v, w Plot1, Plot2, Plot3 GDB1, GDB2, . . . , GDB9, GDB0 TI-83 Plus Operating the TI-83 Plus Silver Edition 26 The TI-83 Plus uses...
User Manual
Page 30
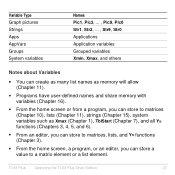
Variable Type Graph pictures Strings Apps AppVars Groups System variables Names Pic1, Pic2, ... , Pic9, Pic0 Str1, Str2, ... , Str9, Str0 Applications Application variables Grouped variables Xmin, Xmax, and others ... to matrices, lists, and Y= functions (Chapter 3). • From the home screen, a program, or an editor, you can store a value to a matrix element or a list element. TI-83 Plus Operating the TI-83 Plus Silver Edition 27
Variable Type Graph pictures Strings Apps AppVars Groups System variables Names Pic1, Pic2, ... , Pic9, Pic0 Str1, Str2, ... , Str9, Str0 Applications Application variables Grouped variables Xmin, Xmax, and others ... to matrices, lists, and Y= functions (Chapter 3). • From the home screen, a program, or an editor, you can store a value to a matrix element or a list element. TI-83 Plus Operating the TI-83 Plus Silver Edition 27
User Manual
Page 31
AppVars is a variable holder used to store and recall graph databases and pictures (Chapter 8). • Although most variables can be archived, system variables including r, t, x, y, and q cannot be archived (Chapter 18) • Apps are independent applications.which are stored in AppVars unless you do so through the application which created them. • You can use DRAW STO menu items to store variables created by independent applications. TI-83 Plus Operating the TI-83 Plus Silver Edition 28 You cannot edit or change variables in Flash ROM.
AppVars is a variable holder used to store and recall graph databases and pictures (Chapter 8). • Although most variables can be archived, system variables including r, t, x, y, and q cannot be archived (Chapter 18) • Apps are independent applications.which are stored in AppVars unless you do so through the application which created them. • You can use DRAW STO menu items to store variables created by independent applications. TI-83 Plus Operating the TI-83 Plus Silver Edition 28 You cannot edit or change variables in Flash ROM.

User Manual
Page 47
X/Y, T/q, and U/V/W variables ZX/ZY, ZT/Zq, and ZU variables Graph database variables Picture variables XY, G, EQ, TEST, and PTS variables TABLE variables String variables TI-83 Plus Operating the TI-83 Plus Silver Edition 44 VARS and VARS Y.VARS Menus VARS Menu You can enter the names of the system variables. 1:Window, 2:Zoom, and 5:Statistics each access more than...
X/Y, T/q, and U/V/W variables ZX/ZY, ZT/Zq, and ZU variables Graph database variables Picture variables XY, G, EQ, TEST, and PTS variables TABLE variables String variables TI-83 Plus Operating the TI-83 Plus Silver Edition 44 VARS and VARS Y.VARS Menus VARS Menu You can enter the names of the system variables. 1:Window, 2:Zoom, and 5:Statistics each access more than...

User Manual
Page 56
... up to three sequences. TI-83 Plus Operating the TI-83 Plus Silver Edition 53 Other TI-83 Plus Features Getting Started has introduced you can graph them For details, refer to: over time. For graphing details, refer to: Chapters 3, 4, 5, 6, 8 The graphing chapters appear in greater detail. Or, you to annotate graphs. Graphing You can use DRAW instructions to basic TI-83 Plus operations. Sequences You can generate...
... up to three sequences. TI-83 Plus Operating the TI-83 Plus Silver Edition 53 Other TI-83 Plus Features Getting Started has introduced you can graph them For details, refer to: over time. For graphing details, refer to: Chapters 3, 4, 5, 6, 8 The graphing chapters appear in greater detail. Or, you to annotate graphs. Graphing You can use DRAW instructions to basic TI-83 Plus operations. Sequences You can generate...

User Manual
Page 57
...operations on them. Also, you can enter and save up to display a graph and its table simultaneously. For details, refer to: Chapter 9 For details, refer to display both a graph and a related editor (such as the Y= editor), the table, the ...stat list editor, or the home screen. For details, refer to: Chapter 7 Split Screen You can create function evaluation tables to analyze many functions simultaneously. Tables You can split the screen horizontally to : Chapter 10 TI-83 Plus Operating the TI-83 Plus Silver Edition...
...operations on them. Also, you can enter and save up to display a graph and its table simultaneously. For details, refer to: Chapter 9 For details, refer to display both a graph and a related editor (such as the Y= editor), the table, the ...stat list editor, or the home screen. For details, refer to: Chapter 7 Split Screen You can create function evaluation tables to analyze many functions simultaneously. Tables You can split the screen horizontally to : Chapter 10 TI-83 Plus Operating the TI-83 Plus Silver Edition...

User Manual
Page 58
You can attach formulas to lists for use lists to evaluate expressions at multiple values simultaneously and to graph a family of curves. For details, refer to : Chapter 12 Inferential Statistics You can perform 16 hypothesis tests and confidence intervals and 15 ...automatic computation. For details, refer to : Chapter 11 Statistics You can perform one- You can define and store up to : Chapter 13 TI-83 Plus Operating the TI-83 Plus Silver Edition 55 Lists You can enter and save as many lists as a histogram, xyLine, scatter plot, modified or regular box-and-whisker plot, ...
You can attach formulas to lists for use lists to evaluate expressions at multiple values simultaneously and to graph a family of curves. For details, refer to : Chapter 12 Inferential Statistics You can perform 16 hypothesis tests and confidence intervals and 15 ...automatic computation. For details, refer to : Chapter 11 Statistics You can perform one- You can define and store up to : Chapter 13 TI-83 Plus Operating the TI-83 Plus Silver Edition 55 Lists You can enter and save as many lists as a histogram, xyLine, scatter plot, modified or regular box-and-whisker plot, ...


