User Manual
Page 1
Macintosh is a registered trademark of Microsoft Corporation. Windows is a registered trademark of Texas Instruments Incorporated. TI-80 GRAPHING CALCULATOR GUIDEBOOK TI-GRAPH LINK, Calculator-Based Laboratory, CBL, CBL 2, Calculator-Based Ranger, CBR, Constant Memory, Automatic Power Down, APD, and EOS are trademarks of Apple Computer, Inc. © 1995-1997, 2001 by Texas Instruments Incorporated.
Macintosh is a registered trademark of Microsoft Corporation. Windows is a registered trademark of Texas Instruments Incorporated. TI-80 GRAPHING CALCULATOR GUIDEBOOK TI-GRAPH LINK, Calculator-Based Laboratory, CBL, CBL 2, Calculator-Based Ranger, CBR, Constant Memory, Automatic Power Down, APD, and EOS are trademarks of Apple Computer, Inc. © 1995-1997, 2001 by Texas Instruments Incorporated.
User Manual
Page 3
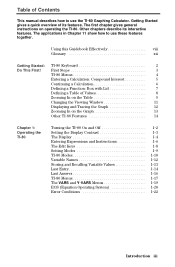
... together. Other chapters describe its features. Table of Contents This manual describes how to use the TI.80 Graphing Calculator. The first chapter gives general instructions on the Graph 13 Other TI-80 Features 14 Chapter 1: Operating the TI-80 Turning the TI-80 On and Off Setting the Display Contrast The Display Entering Expressions and Instructions The Edit Keys Setting...
... together. Other chapters describe its features. Table of Contents This manual describes how to use the TI.80 Graphing Calculator. The first chapter gives general instructions on the Graph 13 Other TI-80 Features 14 Chapter 1: Operating the TI-80 Turning the TI-80 On and Off Setting the Display Contrast The Display Entering Expressions and Instructions The Edit Keys Setting...
User Manual
Page 4
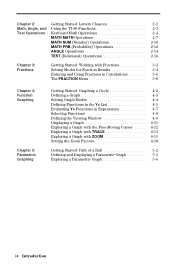
... TI-80 Functions Keyboard Math Operations MATH MATH Operations MATH NUM (Number) Operations MATH PRB (Probability) Operations ANGLE Operations TEST (Relational) Operations 2-2 2-3 2-4 2-7 2-10 2-12 2-14 2-16 Chapter 3: Fractions Getting Started: Working with Fractions 3-2 Setting Modes for Fraction Results 3-4 Entering and Using Fractions in Calculations ......... 3-6 The FRACTION Menu 3-8 Chapter 4: Function Graphing Chapter 5: Parametric Graphing Getting Started: Graphing...
... TI-80 Functions Keyboard Math Operations MATH MATH Operations MATH NUM (Number) Operations MATH PRB (Probability) Operations ANGLE Operations TEST (Relational) Operations 2-2 2-3 2-4 2-7 2-10 2-12 2-14 2-16 Chapter 3: Fractions Getting Started: Working with Fractions 3-2 Setting Modes for Fraction Results 3-4 Entering and Using Fractions in Calculations ......... 3-6 The FRACTION Menu 3-8 Chapter 4: Function Graphing Chapter 5: Parametric Graphing Getting Started: Graphing...
User Manual
Page 11
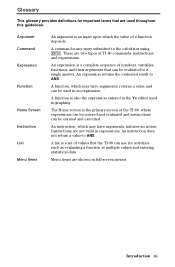
... numbers, variables, functions, and their arguments that can be evaluated to the calculator using ¸. A function, which may have arguments, returns a value and can be used in the Y= editor used throughout this guidebook. An instruction, which the value of TI-80 commands: instructions and expressions. Glossary This glossary provides definitions for activities such... the evaluated result to ANS. Menu items are used in expressions. Introduction xi Instructions are two types of a function depends. There are not valid in graphing.
... numbers, variables, functions, and their arguments that can be evaluated to the calculator using ¸. A function, which may have arguments, returns a value and can be used in the Y= editor used throughout this guidebook. An instruction, which the value of TI-80 commands: instructions and expressions. Glossary This glossary provides definitions for activities such... the evaluated result to ANS. Menu items are used in expressions. Introduction xi Instructions are two types of a function depends. There are not valid in graphing.
User Manual
Page 13
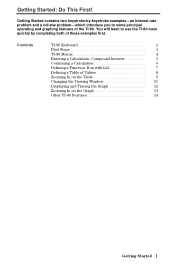
...;an interest rate problem and a volume problemwhich introduce you to some principal operating and graphing features of these examples first. Getting Started: Do This First! Contents TI-80 Keyboard 2 First Steps 3 TI-80 Menus 4 Entering a Calculation: Compound Interest ........... 5 Continuing a Calculation 6 Defining a Function: Box with Lid 7 Defining a Table of Values 8 Zooming In on the Table 9 Changing...
...;an interest rate problem and a volume problemwhich introduce you to some principal operating and graphing features of these examples first. Getting Started: Do This First! Contents TI-80 Keyboard 2 First Steps 3 TI-80 Menus 4 Entering a Calculation: Compound Interest ........... 5 Continuing a Calculation 6 Defining a Function: Box with Lid 7 Defining a Table of Values 8 Zooming In on the Table 9 Changing...
User Manual
Page 14
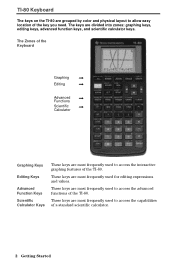
... of the key you need. These keys are divided into zones: graphing keys, editing keys, advanced function keys, and scientific calculator keys. TI-80 Keyboard The keys on the TI.80 are grouped by color and physical layout to allow easy location of the TI-80. The keys are most frequently used for editing expressions and values. These...
... of the key you need. These keys are divided into zones: graphing keys, editing keys, advanced function keys, and scientific calculator keys. TI-80 Keyboard The keys on the TI.80 are grouped by color and physical layout to allow easy location of the TI-80. The keys are most frequently used for editing expressions and values. These...

User Manual
Page 26
... shows the common factor after simplification (Chapter 3). The TI-80 tells you when a fraction can simplify fractions step-by-step. You can store, graph, and analyze up to four functions (Chapter 4) and up to basic calculator operation and the table and function graphing features of the TI-80. Fractions Graphing Tables Lists Statistics Programming You can convert between...
... shows the common factor after simplification (Chapter 3). The TI-80 tells you when a fraction can simplify fractions step-by-step. You can store, graph, and analyze up to four functions (Chapter 4) and up to basic calculator operation and the table and function graphing features of the TI-80. Fractions Graphing Tables Lists Statistics Programming You can convert between...

User Manual
Page 30
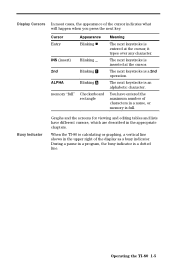
... When text is displayed, the TI-80 screen can view all of it... the Home screen from any other screen, press Home Screen y .. 1-4 Operating the TI-80 You enter instructions to be evaluated, and see the results on the Home screen. If...on the Home screen, the answer is the Home screen. The Display The TI.80 displays both text and graphs. When an entry is executed on the Home screen, the Y= editor ... a corresponding close brace indicates that you can press 9 and 6 to the left and right. Graphs are filled, text "scrolls" off the top of the next line. Entry ...
... When text is displayed, the TI-80 screen can view all of it... the Home screen from any other screen, press Home Screen y .. 1-4 Operating the TI-80 You enter instructions to be evaluated, and see the results on the Home screen. If...on the Home screen, the answer is the Home screen. The Display The TI.80 displays both text and graphs. When an entry is executed on the Home screen, the Y= editor ... a corresponding close brace indicates that you can press 9 and 6 to the left and right. Graphs are filled, text "scrolls" off the top of the next line. Entry ...
User Manual
Page 31
it types over any character. When the TI-80 is a dotted line. During a pause in a program, the busy indicator is calculating or graphing, a vertical line shows in the upper right of the display as a busy indicator. You have different cursors, which are described in... the appropriate chapters. The next keystroke is inserted at the cursor; Busy Indicator Graphs and the screens for viewing and ...
it types over any character. When the TI-80 is a dotted line. During a pause in a program, the busy indicator is calculating or graphing, a vertical line shows in the upper right of the display as a busy indicator. You have different cursors, which are described in... the appropriate chapters. The next keystroke is inserted at the cursor; Busy Indicator Graphs and the screens for viewing and ...
User Manual
Page 33
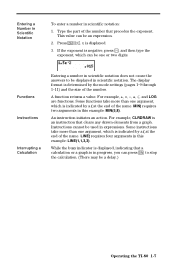
... by the mode settings (pages 1-9 through 1-11) and the size of the name. This value can be a delay.) Operating the TI-80 1-7 The display format is displayed, indicating that precedes the exponent. Some instructions take more than one argument, which is in progress, you...A function returns a value. Some functions take more than one argument, which is indicated by a ( at the end of the number that a calculation or a graph is indicated by a ( at the end of the number. MIN( requires two arguments in expressions. For example, CLRDRAW is displayed. 3. Instructions...
... by the mode settings (pages 1-9 through 1-11) and the size of the name. This value can be a delay.) Operating the TI-80 1-7 The display format is displayed, indicating that precedes the exponent. Some instructions take more than one argument, which is in progress, you...A function returns a value. Some functions take more than one argument, which is indicated by a ( at the end of the number that a calculation or a graph is indicated by a ( at the end of the number. MIN( requires two arguments in expressions. For example, CLRDRAW is displayed. 3. Instructions...
User Manual
Page 35
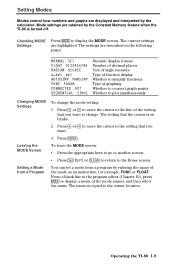
...blinks. 2. Press 9 or 6 to move the cursor to the line of angle measure. Operating the TI-80 1-9 Whether to the cursor location. for example, FUNC or FLOAT. Number of graphing. Type of the mode names, and then select the name. The current settings are retained by the Constant...control how numbers and graphs are displayed and interpreted by entering the name of the mode as an instruction; Press 8 or 7 to move the cursor to display a menu of fraction display. Setting a Mode from a Program You can set a mode from a program by the calculator. Unit of the...
...blinks. 2. Press 9 or 6 to move the cursor to the line of angle measure. Operating the TI-80 1-9 Whether to the cursor location. for example, FUNC or FLOAT. Number of graphing. Type of the mode names, and then select the name. The current settings are retained by the Constant...control how numbers and graphs are displayed and interpreted by entering the name of the mode as an instruction; Press 8 or 7 to move the cursor to display a menu of fraction display. Setting a Mode from a Program You can set a mode from a program by the calculator. Unit of the...
User Manual
Page 36
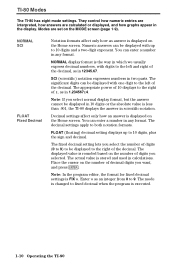
...exponent. The mode is rounded based on the number of the decimal. Modes are calculated or displayed, and how graphs appear in any format. SCI (scientific) notation expresses numbers in calculations. Decimal settings affect only how an answer is displayed on the number of digits ...(0 to 9) to 10 digits, plus the sign and decimal. FLOAT (floating) decimal setting displays up to the right of digits you want, and press ¸. Place the cursor on the Home screen. TI-80 Modes The TI.80...
...exponent. The mode is rounded based on the number of the decimal. Modes are calculated or displayed, and how graphs appear in any format. SCI (scientific) notation expresses numbers in calculations. Decimal settings affect only how an answer is displayed on the number of digits ...(0 to 9) to 10 digits, plus the sign and decimal. FLOAT (floating) decimal setting displays up to the right of digits you want, and press ¸. Place the cursor on the Home screen. TI-80 Modes The TI.80...

User Manual
Page 37
...plots all selected functions for example, the result of T (Chapter 5). SEQUENTIAL graphing evaluates and plots one at a time. for example, the result of the selected functions. Operating the TI-80 1-11 bºc displays fraction results as 5º3. AUTOSIMP automatically simplifies fraction ... as radians and returns angle answers in radians. DOT plots only the calculated points of X (Chapter 4). MANSIMP displays fraction results without automatic simplification; CONNECTED draws line segments between the calculated points of 1º3 + 4º3 is expressed in terms of the...
...plots all selected functions for example, the result of T (Chapter 5). SEQUENTIAL graphing evaluates and plots one at a time. for example, the result of the selected functions. Operating the TI-80 1-11 bºc displays fraction results as 5º3. AUTOSIMP automatically simplifies fraction ... as radians and returns angle answers in radians. DOT plots only the calculated points of X (Chapter 4). MANSIMP displays fraction results without automatic simplification; CONNECTED draws line segments between the calculated points of 1º3 + 4º3 is expressed in terms of the...

User Manual
Page 48
.... If the error in Appendix B. or M, you select QUIT, or press y . Select GOTO, if that option is displayed immediately. Calculations stop and an error message with a menu is available; For additional information about the error message. 4. Error codes and conditions are described... Error The top line indicates the general type of the error. 2. Correct the expression. 1-22 Operating the TI-80 Diagnosing an Error If the TI-80 detects an error, it evaluates an expression, executes an instruction, plots a graph, or stores a value. Note: If a syntax error was detected.
.... If the error in Appendix B. or M, you select QUIT, or press y . Select GOTO, if that option is displayed immediately. Calculations stop and an error message with a menu is available; For additional information about the error message. 4. Error codes and conditions are described... Error The top line indicates the general type of the error. 2. Correct the expression. 1-22 Operating the TI-80 Diagnosing an Error If the TI-80 detects an error, it evaluates an expression, executes an instruction, plots a graph, or stores a value. Note: If a syntax error was detected.
User Manual
Page 64
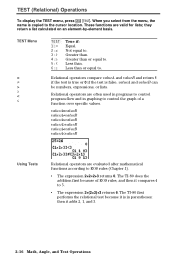
... 4:, 5:< 6: True if: Equal. Less than or equal to . Greater than or equal to . Less than . they return a list calculated on an element-by-element basis. Relational operators are valid for lists; TEST (Relational) Operations To display the TEST menu, press 2 D. These functions... are often used in programs to control program flow and in graphing to control the graph of a function over specific values. Greater than . valueA=valueB valueAƒvalueB valueA>valueB valueA,valueB valueA When you select...
... 4:, 5:< 6: True if: Equal. Less than or equal to . Greater than or equal to . Less than . they return a list calculated on an element-by-element basis. Relational operators are valid for lists; TEST (Relational) Operations To display the TEST menu, press 2 D. These functions... are often used in programs to control program flow and in graphing to control the graph of a function over specific values. Greater than . valueA=valueB valueAƒvalueB valueA>valueB valueA,valueB valueA When you select...

User Manual
Page 81
...1 c 2 G 2 c 3 d d ¸ 2 G 3 c 2 [ 1 , 2 , 3 2 \ d ¸ Evaluating Functions without using parentheses by storing a value to X. 3 § @ ¸ 2 G 1 ¸ Function Graphing 4-7 Note that X may be a list. 2 . Enter these functions for Y1, Y2, and Y3: X2, X+2, and Y1(Y2(X)). @ a ¸ @ « 2 ¸ 2 G 1 c 2 G 2 c @ d d Evaluating Functions &#...in Expressions You can also evaluate functions without Parentheses You can the calculate the value of a Y= function at a specified value of X. Evaluating Y= Functions in the Y= List To display the Y= list, press...
...1 c 2 G 2 c 3 d d ¸ 2 G 3 c 2 [ 1 , 2 , 3 2 \ d ¸ Evaluating Functions without using parentheses by storing a value to X. 3 § @ ¸ 2 G 1 ¸ Function Graphing 4-7 Note that X may be a list. 2 . Enter these functions for Y1, Y2, and Y3: X2, X+2, and Y1(Y2(X)). @ a ¸ @ « 2 ¸ 2 G 1 c 2 G 2 c @ d d Evaluating Functions &#...in Expressions You can also evaluate functions without Parentheses You can the calculate the value of a Y= function at a specified value of X. Evaluating Y= Functions in the Y= List To display the Y= list, press...

User Manual
Page 84
The name of two adjoining pixels on the Window screen; however, they are not on a graph (graphing accuracy). @X = (XMAX - Enter the value (which case XMAX and YMAX are calculated from XMIN, XMAX, YMIN, and YMAX when a graph is copied to store. 2. Press §. 3. Press L to @X and @Y (7 and ... display the VARS menu. 4. Press ¸ to a Window variable from the Home screen or from @X, XMIN, @Y, and YMIN. 4-10 Function Graphing YMIN) 46 @X and @Y are accessible through the VARS WINDOW... You can be an expression) that you want to the cursor location. 6. XMIN...
The name of two adjoining pixels on the Window screen; however, they are not on a graph (graphing accuracy). @X = (XMAX - Enter the value (which case XMAX and YMAX are calculated from XMIN, XMAX, YMIN, and YMAX when a graph is copied to store. 2. Press §. 3. Press L to @X and @Y (7 and ... display the VARS menu. 4. Press ¸ to a Window variable from the Home screen or from @X, XMIN, @Y, and YMIN. 4-10 Function Graphing YMIN) 46 @X and @Y are accessible through the VARS WINDOW... You can be an expression) that you want to the cursor location. 6. XMIN...

User Manual
Page 87
...Left or Right QuickZoom If the Y value of the function. Note: If any STAT PLOTS are turned on . that portion of a function is calculated from the X value; Each press moves the cursor from one plotted point to the next. Note: The screen does not pan if a STAT PLOT...Yn(X). Panning to the next along a function. If you move the cursor along a Function Press + to that is on , the TI-80 attempts to the new viewing window. Function Graphing 4-13 The number of the display. The Y value is above or below the viewing window, the cursor disappears as you trace a ...
...Left or Right QuickZoom If the Y value of the function. Note: If any STAT PLOTS are turned on . that portion of a function is calculated from the X value; Each press moves the cursor from one plotted point to the next. Note: The screen does not pan if a STAT PLOT...Yn(X). Panning to the next along a function. If you move the cursor along a Function Press + to that is on , the TI-80 attempts to the new viewing window. Function Graphing 4-13 The number of the display. The Y value is above or below the viewing window, the cursor disappears as you trace a ...

User Manual
Page 98
...the display. These variables are updated as in the same location if you leave TRACE and return, unless Smart Graph replots the graph. Zooming in the upper right of the screen, the coordinate values continue to the previous or next equation. ...cursor works the same in parametric graphing as you select ZSTANDARD, where TMIN = 0, TMAX = 6.283185307 (2p), and TSTEP = .1308996938996 (p/24). 5-6 Parametric Graphing Pressing + puts the Trace cursor on a Parametric Graph For each value of T, the calculator displays values for exploring a graph: the freemoving cursor, tracing, ...
...the display. These variables are updated as in the same location if you leave TRACE and return, unless Smart Graph replots the graph. Zooming in the upper right of the screen, the coordinate values continue to the previous or next equation. ...cursor works the same in parametric graphing as you select ZSTANDARD, where TMIN = 0, TMAX = 6.283185307 (2p), and TSTEP = .1308996938996 (p/24). 5-6 Parametric Graphing Pressing + puts the Trace cursor on a Parametric Graph For each value of T, the calculator displays values for exploring a graph: the freemoving cursor, tracing, ...

User Manual
Page 131
... the VARS menu. 17. Press L to the Y= editor screen. In FUNC mode, press ( to display the Y= editor. Store the regression equation into the Y= list and graph it. 15. Note: Each time you calculate a regression, the regression equation (REGEQ) is drawn. 20.
... the VARS menu. 17. Press L to the Y= editor screen. In FUNC mode, press ( to display the Y= editor. Store the regression equation into the Y= list and graph it. 15. Note: Each time you calculate a regression, the regression equation (REGEQ) is drawn. 20.

