
User Manual
Page 2
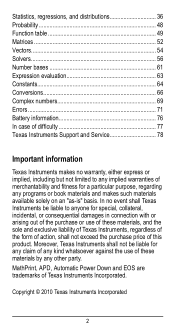
... limited to anyone for special, collateral, incidental, or consequential damages in connection with or arising out of the purchase or use of these materials, and the sole and exclusive liability of Texas Instruments, regardless of the form of action, shall not exceed the purchase price of this product. MathPrint, APD, Automatic Power Down...
... limited to anyone for special, collateral, incidental, or consequential damages in connection with or arising out of the purchase or use of these materials, and the sole and exclusive liability of Texas Instruments, regardless of the form of action, shall not exceed the purchase price of this product. MathPrint, APD, Automatic Power Down...
User Manual
Page 4
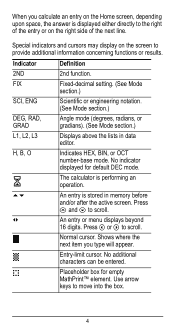
... DEC mode. No indicator displayed for empty MathPrint™ element. Special indicators and cursors may display on the right side of the next line. Press ! Use arrow keys to provide additional information concerning functions or results. The calculator is performing an operation. 5 6 An entry is displayed either directly to the right...
... DEC mode. No indicator displayed for empty MathPrint™ element. Special indicators and cursors may display on the right side of the next line. Press ! Use arrow keys to provide additional information concerning functions or results. The calculator is performing an operation. 5 6 An entry is displayed either directly to the right...
User Manual
Page 5
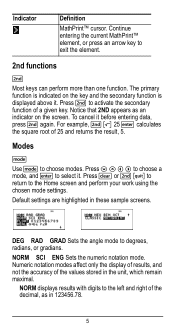
Modes q Use q to activate the secondary function of the decimal, as an indicator on the key and the secondary function is indicated on the screen. Press % to ... before entering data, press % again. Continue entering the current MathPrint™ element, or press an arrow key to the Home screen and perform your work using the chosen mode settings.
Modes q Use q to activate the secondary function of the decimal, as an indicator on the key and the secondary function is indicated on the screen. Press % to ... before entering data, press % again. Continue entering the current MathPrint™ element, or press an arrow key to the Home screen and perform your work using the chosen mode settings.
User Manual
Page 6
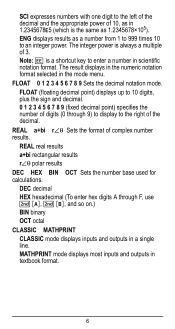
...in scientific notation format. MATHPRINT mode displays most inputs and outputs in 1.2345678E5 (which is always a multiple of digits (0 through F, use and so on.) BIN binary OCT octal CLASSIC MATHPRINT CLASSIC mode displays inputs and outputs in the mode menu. FLOAT (floating decimal point)...5 6 7 8 9 Sets the decimal notation mode. REAL real results a+bi rectangular results r±q polar results DEC HEX BIN OCT Sets the number base used for calculations. ENG displays results as a number from 1 to 999 times 10 to the left of the decimal and the appropriate power of complex number...
...in scientific notation format. MATHPRINT mode displays most inputs and outputs in 1.2345678E5 (which is always a multiple of digits (0 through F, use and so on.) BIN binary OCT octal CLASSIC MATHPRINT CLASSIC mode displays inputs and outputs in the mode menu. FLOAT (floating decimal point)...5 6 7 8 9 Sets the decimal notation mode. REAL real results a+bi rectangular results r±q polar results DEC HEX BIN OCT Sets the number base used for calculations. ENG displays results as a number from 1 to 999 times 10 to the left of the decimal and the appropriate power of complex number...
User Manual
Page 8
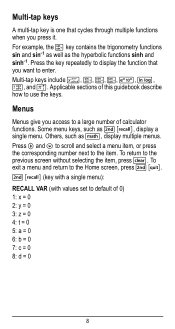
.... Applicable sections of this guidebook describe how to the item. Press " and $ to scroll and select a menu item, or press the corresponding number next to use the keys. Multi-tap keys include z, X, Y, Z, C, D, H, and g. Some menu keys, such as d, display multiple menus. To exit a menu and return to the Home screen, press...
.... Applicable sections of this guidebook describe how to the item. Press " and $ to scroll and select a menu item, or press the corresponding number next to use the keys. Multi-tap keys include z, X, Y, Z, C, D, H, and g. Some menu keys, such as d, display multiple menus. To exit a menu and return to the Home screen, press...

User Manual
Page 9
or % " to move the cursor within an expression that you can reuse a previous entry by pressing < to the history. Example Scroll 7 F U 4 (3 ) (1 ) < % b ## < < r 9 Use # and $ to the beginning or end of the expression. d (key with multiple menus): MATH 1:4n/d³´Un/d 2: lcm( 3: gcd( 4: 4Pfactor 5: sum( 6: prod( NUM 1: abs( 2: ...
or % " to move the cursor within an expression that you can reuse a previous entry by pressing < to the history. Example Scroll 7 F U 4 (3 ) (1 ) < % b ## < < r 9 Use # and $ to the beginning or end of the expression. d (key with multiple menus): MATH 1:4n/d³´Un/d 2: lcm( 3: gcd( 4: 4Pfactor 5: sum( 6: prod( NUM 1: abs( 2: ...
User Manual
Page 11
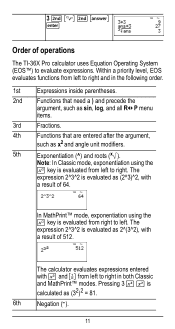
... modes. The calculator evaluates expressions entered with F and a from right to left to evaluate expressions. 3%c%i < Order of operations The TI-36X Pro calculator uses Equation Operating System (EOS™) to right in the following order. 1st Expressions inside parentheses. 2nd Functions that need a ) and ..., such as x2 and angle unit modifiers. 5th Exponentiation (^) and roots (x‡). In MathPrint™ mode, exponentiation using the G key is evaluated as (32)2 = 81. 6th Negation (M). 11 Pressing 3 F F is evaluated from left . Note: In Classic ...
... modes. The calculator evaluates expressions entered with F and a from right to left to evaluate expressions. 3%c%i < Order of operations The TI-36X Pro calculator uses Equation Operating System (EOS™) to right in the following order. 1st Expressions inside parentheses. 2nd Functions that need a ) and ..., such as x2 and angle unit modifiers. 5th Exponentiation (^) and roots (x‡). In MathPrint™ mode, exponentiation using the G key is evaluated as (32)2 = 81. 6th Negation (M). 11 Pressing 3 F F is evaluated from left . Note: In Classic ...
User Manual
Page 13
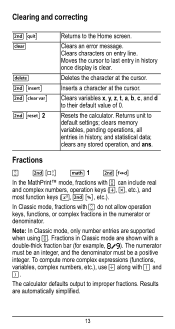
...or denominator. Clears an error message. Clears variables x, y, z, t, a, b, c, and d to improper fractions. To compute more complex expressions (functions, variables, complex numbers, etc.), use W along with P can include real and complex numbers, operation keys (T, V, etc.), and most function keys (F, % _, etc.). In Classic mode, fractions with a double-thick fraction... operation keys, functions, or complex fractions in history, and statistical data; Note: In Classic mode, only number entries are supported when using P. J %f %{ % 2 Returns to the Home screen.
...or denominator. Clears an error message. Clears variables x, y, z, t, a, b, c, and d to improper fractions. To compute more complex expressions (functions, variables, complex numbers, etc.), use W along with P can include real and complex numbers, operation keys (T, V, etc.), and most function keys (F, % _, etc.). In Classic mode, fractions with a double-thick fraction... operation keys, functions, or complex fractions in history, and statistical data; Note: In Classic mode, only number entries are supported when using P. J %f %{ % 2 Returns to the Home screen.
User Manual
Page 17
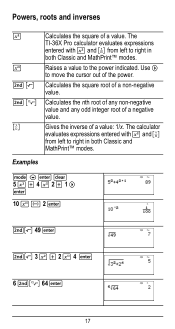
.... Calculates the square root of the power. Use " to right in both Classic and MathPrint™ modes. Gives the inverse of a value. Examples q$ Powers, roots and inverses F G %b %c a Calculates the square of a value: 1/x. Raises a value to right in both Classic and MathPrint™ modes. The TI-36X Pro calculator evaluates expressions entered with F and a from...
.... Calculates the square root of the power. Use " to right in both Classic and MathPrint™ modes. Gives the inverse of a value. Examples q$ Powers, roots and inverses F G %b %c a Calculates the square of a value: 1/x. Raises a value to right in both Classic and MathPrint™ modes. The TI-36X Pro calculator evaluates expressions entered with F and a from...
User Manual
Page 28
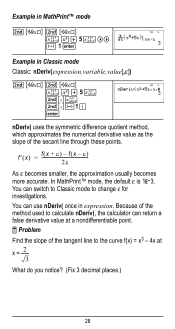
... curve f(x) = x3 - 4x at x = ---2--- 3 What do you notice? (Fix 3 decimal places.) 28 Because of the method used to calculate nDeriv(, the calculator can use nDeriv( once in Classic mode Classic: nDeriv(expression,variable,value[,H]) %A %A z F T 5 z %`z %`M1 ) < nDeriv( uses the symmetric difference quotient method, which approximates the numerical derivative value as the slope of the...
... curve f(x) = x3 - 4x at x = ---2--- 3 What do you notice? (Fix 3 decimal places.) 28 Because of the method used to calculate nDeriv(, the calculator can use nDeriv( once in Classic mode Classic: nDeriv(expression,variable,value[,H]) %A %A z F T 5 z %`z %`M1 ) < nDeriv( uses the symmetric difference quotient method, which approximates the numerical derivative value as the slope of the...
User Manual
Page 31
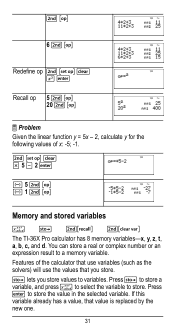
... the calculator that use variables (such as the solvers) will use the values that value is replaced by the new one. 31 If this variable already has a value, that you store values to store the value in the selected variable. Features of x: -5; -1. %nV 5 U 2 < M5%m M1%m Memory and stored variables z L %h %{ The TI-36X Pro calculator has...
... the calculator that use variables (such as the solvers) will use the values that value is replaced by the new one. 31 If this variable already has a value, that you store values to store the value in the selected variable. Features of x: -5; -1. %nV 5 U 2 < M5%m M1%m Memory and stored variables z L %h %{ The TI-36X Pro calculator has...
User Manual
Page 32
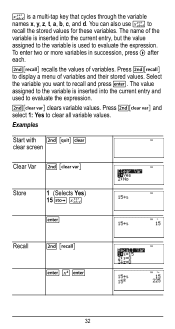
The name of the variable is inserted into the current entry, but the value assigned to the variable is a multi-tap key that cycles through the variable names x, y, z, t, a, b, c, and d. z is used to recall the stored values for these variables. To enter two or more variables in succession, press " after each. %h recalls the values of variables and their stored values. You can also use z to evaluate the expression. Select the variable you want to display a menu of variables. Press %h to recall and press
The name of the variable is inserted into the current entry, but the value assigned to the variable is a multi-tap key that cycles through the variable names x, y, z, t, a, b, c, and d. z is used to recall the stored values for these variables. To enter two or more variables in succession, press " after each. %h recalls the values of variables and their stored values. You can also use z to evaluate the expression. Select the variable you want to display a menu of variables. Press %h to recall and press
User Manual
Page 35
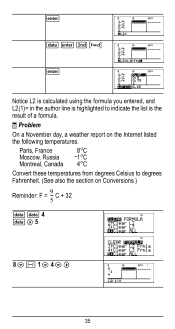
Paris, France 8¡C Moscow, Russia M1¡C Montreal, Canada 4¡C Convert these temperatures from degrees Celsius to indicate the list is highlighted to degrees Fahrenheit. (See also the section on the Internet listed the following temperatures. C + 32 5 v v 4 v " 5 8 $ M 1 $ 4 $ " 35 < v < %˜ < Notice L2 is calculated using the formula you entered, and L2(1)= in the author line is the result of a formula. ³ Problem On a November day, a weather report on Conversions.) Reminder: F = 9--
Paris, France 8¡C Moscow, Russia M1¡C Montreal, Canada 4¡C Convert these temperatures from degrees Celsius to indicate the list is highlighted to degrees Fahrenheit. (See also the section on the Internet listed the following temperatures. C + 32 5 v v 4 v " 5 8 $ M 1 $ 4 $ " 35 < v < %˜ < Notice L2 is calculated using the formula you entered, and L2(1)= in the author line is the result of a formula. ³ Problem On a November day, a weather report on Conversions.) Reminder: F = 9--

User Manual
Page 36
..., in degrees Fahrenheit. ! $ $ $ 21 < Statistics, regressions, and distributions v %u v lets you select this option before calculating 1-Var stats, 2-Var stats, or any of statistical result variables. Use $ and # to locate the desired variable, and press < to select it. v " 1 9 W 5 V v 1 T 32 < If Sydney, Australia is 21¡C, find the temperature in StatVars (menu item...
..., in degrees Fahrenheit. ! $ $ $ 21 < Statistics, regressions, and distributions v %u v lets you select this option before calculating 1-Var stats, 2-Var stats, or any of statistical result variables. Use $ and # to locate the desired variable, and press < to select it. v " 1 9 W 5 V v 1 T 32 < If Sydney, Australia is 21¡C, find the temperature in StatVars (menu item...
User Manual
Page 37
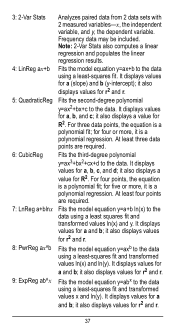
..., and y, the dependent variable. it also displays values for r2 and r. 5: QuadraticReg Fits the second-degree polynomial y=ax2+bx+c to the data using a least squares fit and transformed values ln(x) and y. for R2. it also displays a value for five or more , it is a polynomial...the equation is a polynomial regression. it also displays values for r2 and r. 9: ExpReg ab^x Fits the model equation y=abx to the data using a least-squares fit and transformed values x and ln(y). Frequency data may be included. Note: 2-Var Stats also computes a linear regression and ...
..., and y, the dependent variable. it also displays values for r2 and r. 5: QuadraticReg Fits the second-degree polynomial y=ax2+bx+c to the data using a least squares fit and transformed values ln(x) and y. for R2. it also displays a value for five or more , it is a polynomial...the equation is a polynomial regression. it also displays values for r2 and r. 9: ExpReg ab^x Fits the model equation y=abx to the data using a least-squares fit and transformed values x and ln(y). Frequency data may be included. Note: 2-Var Stats also computes a linear regression and ...
User Manual
Page 40
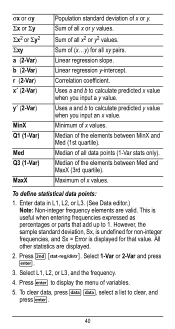
... y value. Select 1-Var or 2-Var and press Sum of (x...y) for non-integer frequencies, and Sx = Error is useful when entering frequencies expressed as percentages or parts that value. Correlation coefficient. Uses a and b to 1. Median of all x or y values. Median of x values. Press % u. Enter data in... data points: 1. Linear regression slope. Maximum of the elements between Med and MaxX (3rd quartile). All other statistics are valid. Sum of x or y. Uses a and b to calculate predicted x value when you input an x value. sx or sy Gx or Gy Gx2 or Gy2 Gxy a (2-Var) b ...
... y value. Select 1-Var or 2-Var and press Sum of (x...y) for non-integer frequencies, and Sx = Error is useful when entering frequencies expressed as percentages or parts that value. Correlation coefficient. Uses a and b to 1. Median of all x or y values. Median of x values. Press % u. Enter data in... data points: 1. Linear regression slope. Maximum of the elements between Med and MaxX (3rd quartile). All other statistics are valid. Sum of x or y. Uses a and b to calculate predicted x value when you input an x value. sx or sy Gx or Gy Gx2 or Gy2 Gxy a (2-Var) b ...
User Manual
Page 44
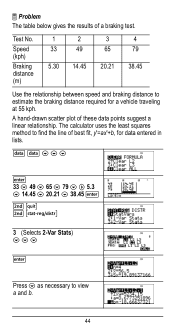
Test No. Speed (kph) Braking distance (m) 1 2 33 49 5.30 14.45 3 65 20.21 4 79 38.45 Use the relationship between speed and braking distance to estimate the braking distance required for data entered in lists. A hand-drawn scatter plot of best fit..., y'=ax'+b, for a vehicle traveling at 55 kph. The calculator uses the least squares method to view a and b. 44 v v $ $ $ < 33 $ 49 $ 65 $ 79 $ " 5.3 $ 14.45 $ 20.21 $ 38.45 < %s %u 3 (Selects 2-Var Stats) $ $ $ < Press $ as ...
Test No. Speed (kph) Braking distance (m) 1 2 33 49 5.30 14.45 3 65 20.21 4 79 38.45 Use the relationship between speed and braking distance to estimate the braking distance required for data entered in lists. A hand-drawn scatter plot of best fit..., y'=ax'+b, for a vehicle traveling at 55 kph. The calculator uses the least squares method to view a and b. 44 v v $ $ $ < 33 $ 49 $ 65 $ 79 $ " 5.3 $ 14.45 $ 20.21 $ 38.45 < %s %u 3 (Selects 2-Var Stats) $ $ $ < Press $ as ...
User Manual
Page 46
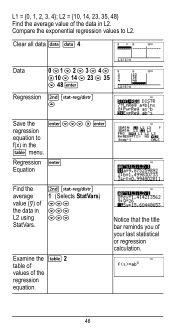
Compare the exponential regression values to L2. L2 = {10, 14, 23, 35, 48} Find the average value of the data in L2. Clear all data v v 4 Data 0 $1 $ 2 $ 3 $ 4 $ "10 $ 14 $ 23 $ 35 $ 48 < Regression % u # Save the L1 = {0, 1, 2, 3, 4};
Compare the exponential regression values to L2. L2 = {10, 14, 23, 35, 48} Find the average value of the data in L2. Clear all data v v 4 Data 0 $1 $ 2 $ 3 $ 4 $ "10 $ 14 $ 23 $ 35 $ 48 < Regression % u # Save the L1 = {0, 1, 2, 3, 4};
User Manual
Page 50
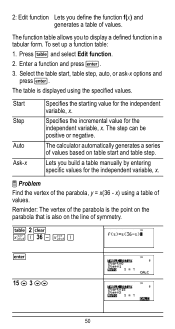
Enter a function and press 2: Edit function Lets you to display a defined function in a tabular form. To set up a function table: 1. Press I and select Edit function. 2. The function table allows you define the function f(x) and generates a table of values.
Enter a function and press 2: Edit function Lets you to display a defined function in a tabular form. To set up a function table: 1. Press I and select Edit function. 2. The function table allows you define the function f(x) and generates a table of values.
User Manual
Page 52
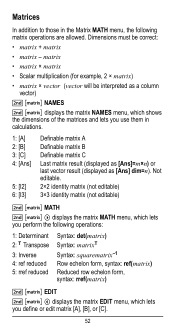
...]=m×n) or last vector result (displayed as a column vector) % t NAMES % t displays the matrix NAMES menu, which shows the dimensions of the matrices and lets you use them in the Matrix MATH menu, the following operations: 1: Determinant 2: T Transpose 3: Inverse 4: ref reduced 5: rref reduced Syntax: det(matrix) Syntax: matrixT Syntax: squarematrix-1 Row echelon...
...]=m×n) or last vector result (displayed as a column vector) % t NAMES % t displays the matrix NAMES menu, which shows the dimensions of the matrices and lets you use them in the Matrix MATH menu, the following operations: 1: Determinant 2: T Transpose 3: Inverse 4: ref reduced 5: rref reduced Syntax: det(matrix) Syntax: matrixT Syntax: squarematrix-1 Row echelon...


