User Manual
Page 32
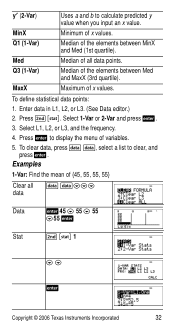
yÅ (2-Var) Uses a and b to calculate predicted y value when you input an x value. Med Median of x values. MaxX Maximum of all data points. MinX Minimum of the elements between Med and MaxX (3rd quartile). Q1 (1-Var) Median of x values. Q3 (1-Var) Median of the elements between MinX and Med (1st quartile). Enter data in L1, L2, or L3. (See Data editor.) 2. Select 1-Var or 2-Var and press To define statistical data points: 1. Press % t.
yÅ (2-Var) Uses a and b to calculate predicted y value when you input an x value. Med Median of x values. MaxX Maximum of all data points. MinX Minimum of the elements between Med and MaxX (3rd quartile). Q1 (1-Var) Median of x values. Q3 (1-Var) Median of the elements between MinX and Med (1st quartile). Enter data in L1, L2, or L3. (See Data editor.) 2. Select 1-Var or 2-Var and press To define statistical data points: 1. Press % t.

