
User Guide
Page 6
Deleting an expression from the history 66 Clearing the Calculator history 67 Where to find more information 67 Using Graphs & Geometry 69 The toolbar 69 The work area 79 The graphing view 79 The plane geometry view 79 The analytic window 80 To remove the analytic window from the work area... ......... 80 Creating and manipulating axes 82 Drawing a circle 84 The entry line 85 Graphing inequalities 86 Finding points of interest: zeroes, minima, maxima 87 Animating objects 88 Animating one point on an object 88 The animation control...
Deleting an expression from the history 66 Clearing the Calculator history 67 Where to find more information 67 Using Graphs & Geometry 69 The toolbar 69 The work area 79 The graphing view 79 The plane geometry view 79 The analytic window 80 To remove the analytic window from the work area... ......... 80 Creating and manipulating axes 82 Drawing a circle 84 The entry line 85 Graphing inequalities 86 Finding points of interest: zeroes, minima, maxima 87 Animating objects 88 Animating one point on an object 88 The animation control...

User Guide
Page 9
...operations of the Notes application. Data Collection - Using Graphs & Geometry - Using Notes- Introduction 1 Provides instruction for technical support. Provides an overview of the TI-Nspire™ handheld. Provides start up information for using the Data ... the basic operation of the Calculator application. Introduction The TI-Nspire™ math and science learning handheld This guidebook provides information about a powerful, advanced learning handheld available from Texas Instruments: the TI-Nspire™handheld. Your learning handheld comes equipped with documents. The...
...operations of the Notes application. Data Collection - Using Graphs & Geometry - Using Notes- Introduction 1 Provides instruction for technical support. Provides an overview of the TI-Nspire™ handheld. Provides start up information for using the Data ... the basic operation of the Calculator application. Introduction The TI-Nspire™ math and science learning handheld This guidebook provides information about a powerful, advanced learning handheld available from Texas Instruments: the TI-Nspire™handheld. Your learning handheld comes equipped with documents. The...

User Guide
Page 26
...; with the USB unit-tounit cable The TI-Nspire™ handheld USB A port is located at the center of the top of the I /O port. 18 Getting Started Sending a document 1. Press c 7 to -unit cable into the other end of the graphing calculator. 1. Insert the other graphing calculator's I /O unit-to open My Documents on the receiving unit. Press...
...; with the USB unit-tounit cable The TI-Nspire™ handheld USB A port is located at the center of the top of the I /O port. 18 Getting Started Sending a document 1. Press c 7 to -unit cable into the other end of the graphing calculator. 1. Insert the other graphing calculator's I /O unit-to open My Documents on the receiving unit. Press...

User Guide
Page 33
... documents. Working with Documents 25 Page Sorter Although the handheld typically displays the pages in your document one at a time, the Page Sorter lets you see all of the problems in your document and all of the TI-Nspire™ math and science learning technology applications (Calculator, Graphs & Geometry, Lists & Spreadsheet, Data & Statistics and Notes). In...
... documents. Working with Documents 25 Page Sorter Although the handheld typically displays the pages in your document one at a time, the Page Sorter lets you see all of the problems in your document and all of the TI-Nspire™ math and science learning technology applications (Calculator, Graphs & Geometry, Lists & Spreadsheet, Data & Statistics and Notes). In...

User Guide
Page 57
... The shared variable A. A[] Column A of an existing variable by entering its name on the Calculator entry line. In the following two examples, two data lists were created in Lists & Spreadsheet ... • To refer to a table column (such as the result. Using (linking) TI-Nspire™ variables Sharing, or linking, the variables you create is automatically updated when the variable's...a pair of linked variables is a powerful tool for math exploration. The value most recently stored in Graphs & Geometry. Use this a reference to current table. column A-never to table ...
... The shared variable A. A[] Column A of an existing variable by entering its name on the Calculator entry line. In the following two examples, two data lists were created in Lists & Spreadsheet ... • To refer to a table column (such as the result. Using (linking) TI-Nspire™ variables Sharing, or linking, the variables you create is automatically updated when the variable's...a pair of linked variables is a powerful tool for math exploration. The value most recently stored in Graphs & Geometry. Use this a reference to current table. column A-never to table ...

User Guide
Page 59
The variable can be any variable in the current problem space and can be defined in Graphs & Geometry, Calculator, or any instance of the variable. Click the cell that you link a cell to a variable, Lists & Spreadsheet keeps the cell value updated to reflect the ...
The variable can be any variable in the current problem space and can be defined in Graphs & Geometry, Calculator, or any instance of the variable. Click the cell that you link a cell to a variable, Lists & Spreadsheet keeps the cell value updated to reflect the ...
User Guide
Page 63
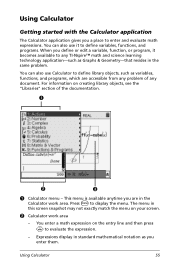
Expressions display in standard mathematical notation as Graphs & Geometry-that resides in the same problem. Using Calculator 55 You can also use Calculator to enter and evaluate math expressions. Using Calculator Getting started with the Calculator application The Calculator application gives you a place to define ...not exactly match the menu on your screen. Á Calculator work area. You enter a math expression on creating library objects, see the "Libraries" section of any TI-Nspire™ math and science learning technology application-such as you enter them. You can...
Expressions display in standard mathematical notation as Graphs & Geometry-that resides in the same problem. Using Calculator 55 You can also use Calculator to enter and evaluate math expressions. Using Calculator Getting started with the Calculator application The Calculator application gives you a place to define ...not exactly match the menu on your screen. Á Calculator work area. You enter a math expression on creating library objects, see the "Libraries" section of any TI-Nspire™ math and science learning technology application-such as you enter them. You can...
User Guide
Page 78
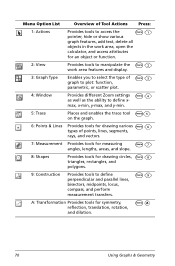
... of Tool Actions Press: 1: Actions Provides tools to access the b 1 pointer, hide or show various graph features, add text, delete all objects in the work area, open the calculator, and access attributes for an object or function. 2: View Provides tools to manipulate the b 2 work area... features and display. 3: Graph Type Enables you to select the type of b 3 graph to plot: function, parametric, or scatter plot. 4: ...
... of Tool Actions Press: 1: Actions Provides tools to access the b 1 pointer, hide or show various graph features, add text, delete all objects in the work area, open the calculator, and access attributes for an object or function. 2: View Provides tools to manipulate the b 2 work area... features and display. 3: Graph Type Enables you to select the type of b 3 graph to plot: function, parametric, or scatter plot. 4: ...

User Guide
Page 79
... Hide/Show Enables you to change the attributes of a line or circle. 7: Calculate Opens the calculator to perform b17 calculations using this tool. b13 4: Delete All Removes all objects and graphed b14 functions from one object to another object. Numerical values can define a point in... user-created alpha-numeric b15 values on using measurements, numerical values, or calculation results. 8: Redefine Redefines a previously defined point to objects. for details on the page. b19 Using Graphs & Geometry 71 b18 9: Data Collection Adds the Data Collection tool to the...
... Hide/Show Enables you to change the attributes of a line or circle. 7: Calculate Opens the calculator to perform b17 calculations using this tool. b13 4: Delete All Removes all objects and graphed b14 functions from one object to another object. Numerical values can define a point in... user-created alpha-numeric b15 values on using measurements, numerical values, or calculation results. 8: Redefine Redefines a previously defined point to objects. for details on the page. b19 Using Graphs & Geometry 71 b18 9: Data Collection Adds the Data Collection tool to the...

User Guide
Page 84
Calculates and displays the b75 numerical value of the integral of a selected function, and shades the area between two b71 selected points or the length of ... or segment. A vertical slope is represented by two points. If you press g while creating the ray, you limit its orientation, relative to point b. 76 Using Graphs & Geometry increments. increments. Creates a tangent line. Measurements Menu Tools Tool name 1: Length 2: Area 3: Slope 4: Angle 5: Integral Tool function Press: Displays the distance between the curve...
Calculates and displays the b75 numerical value of the integral of a selected function, and shades the area between two b71 selected points or the length of ... or segment. A vertical slope is represented by two points. If you press g while creating the ray, you limit its orientation, relative to point b. 76 Using Graphs & Geometry increments. increments. Creates a tangent line. Measurements Menu Tools Tool name 1: Length 2: Area 3: Slope 4: Angle 5: Integral Tool function Press: Displays the distance between the curve...
User Guide
Page 89
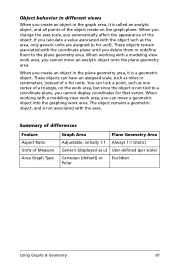
...calculate a value associated with the object such as miles or centimeters, instead of u for units. These objects can have an assigned scale, such as the area, only generic units are assigned (u for that vertex. When you change the axes scale, you automatically affect the appearance of Measure Area Graph Type Graph... Area Plane Geometry Area Adjustable; initially 1:1 Always 1:1 (static) Generic (displayed as one vertex of a triangle, on the graph plane. When working with a modeling view work area...
...calculate a value associated with the object such as miles or centimeters, instead of u for units. These objects can have an assigned scale, such as the area, only generic units are assigned (u for that vertex. When you change the axes scale, you automatically affect the appearance of Measure Area Graph Type Graph... Area Plane Geometry Area Adjustable; initially 1:1 Always 1:1 (static) Generic (displayed as one vertex of a triangle, on the graph plane. When working with a modeling view work area...

User Guide
Page 101
... or math expressions. • Define a table cell in Calculator or Graphs & Geometry. • Perform statistical analysis on lists of other columns or sequences that you define. • Share individual cells with tabular data. You can use Lists & Spreadsheet to work with other TI-Nspire™ math and science learning ... cells. • Define an entire column in terms of another column. • Work with variables created in the Graphs & Geometry and Calculator applications. • Collect tables of real-world data from functions defined in terms of the contents of data.
... or math expressions. • Define a table cell in Calculator or Graphs & Geometry. • Perform statistical analysis on lists of other columns or sequences that you define. • Share individual cells with tabular data. You can use Lists & Spreadsheet to work with other TI-Nspire™ math and science learning ... cells. • Define an entire column in terms of another column. • Work with variables created in the Graphs & Geometry and Calculator applications. • Collect tables of real-world data from functions defined in terms of the contents of data.

User Guide
Page 103
... above the current row. Use / ^ to the specified cell, such as d16 or g20. Inserts a cell. Allows manual or automatic capture of variable data from Graphs & Geometry, Calculator, or within a column. Using Lists & Spreadsheet 95 Lets you insert a range of cells into a cell formula. Data Generate Sequence Data Capture Fill Down Displays...
... above the current row. Use / ^ to the specified cell, such as d16 or g20. Inserts a cell. Allows manual or automatic capture of variable data from Graphs & Geometry, Calculator, or within a column. Using Lists & Spreadsheet 95 Lets you insert a range of cells into a cell formula. Data Generate Sequence Data Capture Fill Down Displays...

User Guide
Page 104
... hypothesis tests such as a dot plot or scatter plot. Lets you perform and plot several statistics calculations, such as one or two selected columns of data as t test, z test, and ANOVA. Function Table Switch to graph one -variable analysis, twovariable analysis, and regressions. Removes the current column. Lets you select a different function...
... hypothesis tests such as a dot plot or scatter plot. Lets you perform and plot several statistics calculations, such as one or two selected columns of data as t test, z test, and ANOVA. Function Table Switch to graph one -variable analysis, twovariable analysis, and regressions. Removes the current column. Lets you select a different function...

User Guide
Page 119
...Examples of residuals. Shade Under Function Lets you graph a statistical value on the page without saving any work area. Show/Hide Power Calculates and displays the Power regression model for the plotted data. Show/Hide Sinusoidal Calculates and displays the Sinusoidal regression model for the ...plotted data. Start Over Erases the content on the axis. This enables you graph a function in the work . Show/Hide Logistic (dƒ0) Calculates and displays the Logistic regression model where Dƒ0, for the plotted data. Show/Hide Residual Squares...
...Examples of residuals. Shade Under Function Lets you graph a statistical value on the page without saving any work area. Show/Hide Power Calculates and displays the Power regression model for the plotted data. Show/Hide Sinusoidal Calculates and displays the Sinusoidal regression model for the ...plotted data. Start Over Erases the content on the axis. This enables you graph a function in the work . Show/Hide Logistic (dƒ0) Calculates and displays the Logistic regression model where Dƒ0, for the plotted data. Show/Hide Residual Squares...

User Guide
Page 120
...columns of a center point. Working with a numerical application like Calculator or Lists & Spreadsheet. It is designed as a place to be plotted in the work area window. Plotting data from spreadsheet data The Quick Graph feature of a center point. Create or display data to explore... and visualize data and graph inferential statistics. Creating plots from Lists & Spreadsheet 1. Values you to zoom out on a...
...columns of a center point. Working with a numerical application like Calculator or Lists & Spreadsheet. It is designed as a place to be plotted in the work area window. Plotting data from spreadsheet data The Quick Graph feature of a center point. Create or display data to explore... and visualize data and graph inferential statistics. Creating plots from Lists & Spreadsheet 1. Values you to zoom out on a...
User Guide
Page 139
Index A absolute cell references in a table 98 accents adding to text 24 adding a Calculator to a page 60 Notes to a page 119 adjacent cells filling 102 analytic and geometric work areas (Graphs & Geometry) 80 analytic/geometric work area differences 81 animating objects 88 animation 88 resetting... Setting tool 84 B back up files to a computer 20 backing up handheld 19 battery status indicator 12 C Calculator adding to a page 60 getting started with 55 Calculator history 65 viewing 65 Calculator toolbar 56, 94 Calculator toolbar, using 60 cancelling a file transfer 54 Catalog accessing 14, 40 ...
Index A absolute cell references in a table 98 accents adding to text 24 adding a Calculator to a page 60 Notes to a page 119 adjacent cells filling 102 analytic and geometric work areas (Graphs & Geometry) 80 analytic/geometric work area differences 81 animating objects 88 animation 88 resetting... Setting tool 84 B back up files to a computer 20 backing up handheld 19 battery status indicator 12 C Calculator adding to a page 60 getting started with 55 Calculator history 65 viewing 65 Calculator toolbar 56, 94 Calculator toolbar, using 60 cancelling a file transfer 54 Catalog accessing 14, 40 ...

User Guide
Page 140
...101 table rows or columns 104 copyright statement ii creating scatter plots (Graphs & Geometry) 90 customer support and service 129 D Data & Statistics...53 viewing pages 37 E editing math expressions 64 entering table data, methods for 97 entering math expressions 60 evaluating math expressions 60 evaluating a math expression 63 evaluating math expressions 60 experiment (Data Collection)... application 122 reusing in Calculator 66 selecting in Calculator 65 F file naming conventions 43 files backing up to a computer 20 naming conventions 43 transferring to another handheld 53 filling adjacent cells...
...101 table rows or columns 104 copyright statement ii creating scatter plots (Graphs & Geometry) 90 customer support and service 129 D Data & Statistics...53 viewing pages 37 E editing math expressions 64 entering table data, methods for 97 entering math expressions 60 evaluating math expressions 60 evaluating a math expression 63 evaluating math expressions 60 experiment (Data Collection)... application 122 reusing in Calculator 66 selecting in Calculator 65 F file naming conventions 43 files backing up to a computer 20 naming conventions 43 transferring to another handheld 53 filling adjacent cells...

User Guide
Page 141
...G geometric shape symbols in Notes application 122 graphing inequalities 86 H handheld backing up 19 handheld status 12 Hide/Show Axes tool 84 Hints viewing 21 history deleting Calculator history 67 in Calculator 65 viewing Calculator 65 Home menu 10 I inequalities graphing 86 inserting a Calculator on a page 60 a row or column ... of 45 Lists & Spreadsheet adding to a page 97 getting started with 93 M math expressions editing 64 entering and evaluating 60 selecting in Calculator 65 templates 23 math templates using 62, 99 matrices examples of 45 maxima finding 87 measurements types that can...
...G geometric shape symbols in Notes application 122 graphing inequalities 86 H handheld backing up 19 handheld status 12 Hide/Show Axes tool 84 Hints viewing 21 history deleting Calculator history 67 in Calculator 65 viewing Calculator 65 Home menu 10 I inequalities graphing 86 inserting a Calculator on a page 60 a row or column ... of 45 Lists & Spreadsheet adding to a page 97 getting started with 93 M math expressions editing 64 entering and evaluating 60 selecting in Calculator 65 templates 23 math templates using 62, 99 matrices examples of 45 maxima finding 87 measurements types that can...

User Guide
Page 143
... 90 Text 86 Variables 46, 50 transferring documents to another handheld 53 files to another handheld 53 transferring files rules 53 transfers cancelling 54 U using variables 49 V variable removing linked 51 variable names examples 48 variables Calculator 47 checking in Calculator 49 creating 45 Graphs & Geometry 46 linking 45, 49 linking to 51 Lists & Spreadsheet...
... 90 Text 86 Variables 46, 50 transferring documents to another handheld 53 files to another handheld 53 transferring files rules 53 transfers cancelling 54 U using variables 49 V variable removing linked 51 variable names examples 48 variables Calculator 47 checking in Calculator 49 creating 45 Graphs & Geometry 46 linking 45, 49 linking to 51 Lists & Spreadsheet...

