Guidebook
Page 1
Windows is a registered trademark of Microsoft Corporation. © 1996, 2000, 2001 Texas Instruments Incorporated. TI-83 GRAPHING CALCULATOR GUIDEBOOK TI-GRAPH LINK, Calculator-Based Laboratory, CBL, CBL 2, Calculator-Based Ranger, CBR, Constant Memory, Automatic Power Down, APD, and EOS are trademarks of International Business Machines Corporation. Macintosh is a registered trademark of Apple Computer, Inc. IBM is a registered trademark of Texas Instruments Incorporated.
Windows is a registered trademark of Microsoft Corporation. © 1996, 2000, 2001 Texas Instruments Incorporated. TI-83 GRAPHING CALCULATOR GUIDEBOOK TI-GRAPH LINK, Calculator-Based Laboratory, CBL, CBL 2, Calculator-Based Ranger, CBR, Constant Memory, Automatic Power Down, APD, and EOS are trademarks of International Business Machines Corporation. Macintosh is a registered trademark of Apple Computer, Inc. IBM is a registered trademark of Texas Instruments Incorporated.
Guidebook
Page 3
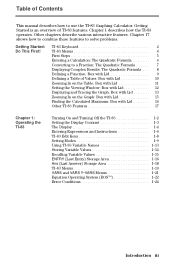
... describes how to solve problems. Getting Started: Do This First! Chapter 17 shows how to combine these features to use the TI.83 Graphing Calculator. TI-83 Keyboard 2 TI-83 Menus 4 First Steps 5 Entering a Calculation: The Quadratic Formula .......... 6 Converting to a Fraction: The Quadratic Formula ........ 7 Displaying Complex Results: The Quadratic Formula .... 8 Defining a Function: Box with Lid 9 Defining...
... describes how to solve problems. Getting Started: Do This First! Chapter 17 shows how to combine these features to use the TI.83 Graphing Calculator. TI-83 Keyboard 2 TI-83 Menus 4 First Steps 5 Entering a Calculation: The Quadratic Formula .......... 6 Converting to a Fraction: The Quadratic Formula ........ 7 Displaying Complex Results: The Quadratic Formula .... 8 Defining a Function: Box with Lid 9 Defining...
Guidebook
Page 4
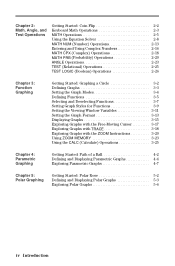
... for Functions 3-9 Setting the Viewing Window Variables 3-11 Setting the Graph Format 3-13 Displaying Graphs 3-15 Exploring Graphs with the Free-Moving Cursor .......... 3-17 Exploring Graphs with TRACE 3-18 Exploring Graphs with the ZOOM Instructions........... 3-20 Using ZOOM MEMORY 3-23 Using the CALC (Calculate) Operations 3-25 Chapter 4: Parametric Graphing Getting Started: Path of a Ball 4-2 Defining and Displaying Parametric...
... for Functions 3-9 Setting the Viewing Window Variables 3-11 Setting the Graph Format 3-13 Displaying Graphs 3-15 Exploring Graphs with the Free-Moving Cursor .......... 3-17 Exploring Graphs with TRACE 3-18 Exploring Graphs with the ZOOM Instructions........... 3-20 Using ZOOM MEMORY 3-23 Using the CALC (Calculate) Operations 3-25 Chapter 4: Parametric Graphing Getting Started: Path of a Ball 4-2 Defining and Displaying Parametric...
Guidebook
Page 7
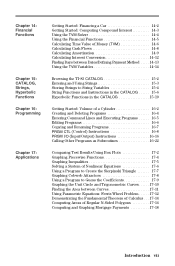
... Value of Money (TVM 14-6 Calculating Cash Flows 14-8 Calculating Amortization 14-9 Calculating Interest Conversion 14-12 Finding Days between Dates/Defining Payment Method ..... 14-13 Using the TVM Variables 14-14 Browsing the TI-83 CATALOG 15-2 Entering and Using Strings 15-3 Storing Strings to... (Input/Output) Instructions 16-16 Calling Other Programs as Subroutines 16-22 Comparing Test Results Using Box Plots 17-2 Graphing Piecewise Functions 17-4 Graphing Inequalities 17-5 Solving a System of Nonlinear Equations 17-6 Using a Program to Create the Sierpinski Triangle ....... 17...
... Value of Money (TVM 14-6 Calculating Cash Flows 14-8 Calculating Amortization 14-9 Calculating Interest Conversion 14-12 Finding Days between Dates/Defining Payment Method ..... 14-13 Using the TVM Variables 14-14 Browsing the TI-83 CATALOG 15-2 Entering and Using Strings 15-3 Storing Strings to... (Input/Output) Instructions 16-16 Calling Other Programs as Subroutines 16-22 Comparing Test Results Using Box Plots 17-2 Graphing Piecewise Functions 17-4 Graphing Inequalities 17-5 Solving a System of Nonlinear Equations 17-6 Using a Program to Create the Sierpinski Triangle ....... 17...
Guidebook
Page 9
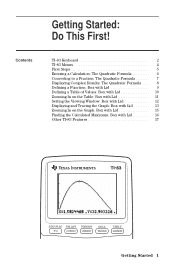
... In on the Table: Box with Lid 11 Setting the Viewing Window: Box with Lid 12 Displaying and Tracing the Graph: Box with Lid ......... 13 Zooming In on the Graph: Box with Lid 15 Finding the Calculated Maximum: Box with Lid.......... 16 Other TI.83 Features 17 Getting Started 1 Getting Started: Do This First!
... In on the Table: Box with Lid 11 Setting the Viewing Window: Box with Lid 12 Displaying and Tracing the Graph: Box with Lid ......... 13 Zooming In on the Graph: Box with Lid 15 Finding the Calculated Maximum: Box with Lid.......... 16 Other TI.83 Features 17 Getting Started 1 Getting Started: Do This First!
Guidebook
Page 10
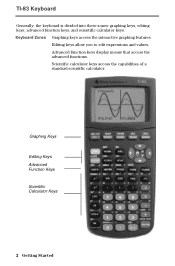
Editing keys allow you to edit expressions and values. Graphing Keys Editing Keys Advanced Function Keys Scientific Calculator Keys 2 Getting Started TI-83 Keyboard Generally, the keyboard is divided into these zones: graphing keys, editing keys, advanced function keys, and scientific calculator keys. Advanced function keys display menus that access the advanced functions. Keyboard Zones Graphing keys access the interactive graphing features. Scientific calculator keys access the capabilities of a standard scientific calculator.
Editing keys allow you to edit expressions and values. Graphing Keys Editing Keys Advanced Function Keys Scientific Calculator Keys 2 Getting Started TI-83 Keyboard Generally, the keyboard is divided into these zones: graphing keys, editing keys, advanced function keys, and scientific calculator keys. Advanced function keys display menus that access the advanced functions. Keyboard Zones Graphing keys access the interactive graphing features. Scientific calculator keys access the capabilities of a standard scientific calculator.
Guidebook
Page 24
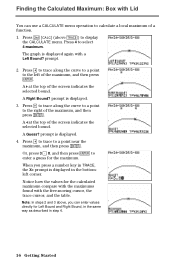
.... 2. prompt is displayed. 4. A 3 at the top of the screen indicates the selected bound. The graph is displayed in the bottomleft corner. A Guess? When you can use a CALCULATE menu operation to calculate a local maximum of the maximum, and then press Í. Note: In steps 2 and 3 above ... maximum, and then press Í. Press | to trace to display the CALCULATE menu. prompt is displayed. 3. Notice how the values for the calculated maximum compare with the maximums found with a Left Bound? Press y [CALC] (above , you press a number key in TRACE, the X= prompt...
.... 2. prompt is displayed. 4. A 3 at the top of the screen indicates the selected bound. The graph is displayed in the bottomleft corner. A Guess? When you can use a CALCULATE menu operation to calculate a local maximum of the maximum, and then press Í. Note: In steps 2 and 3 above ... maximum, and then press Í. Press | to trace to display the CALCULATE menu. prompt is displayed. 3. Notice how the values for the calculated maximum compare with the maximums found with a Left Bound? Press y [CALC] (above , you press a number key in TRACE, the X= prompt...
Guidebook
Page 30
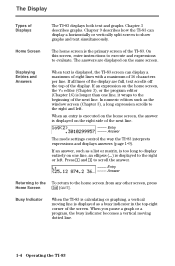
...the display. Entry Answer The mode settings control the way the TI.83 interprets expressions and displays answers (page 1.9). Entry Answer Returning to the To return to show graphs and text simultaneously. Chapter 3 describes graphs. The answers are full, text scrolls off the top of the next...as a list or matrix, is too long to the right and left . Busy Indicator When the TI.83 is calculating or graphing, a vertical moving dotted line. 1-4 Operating the TI-83 The Display Types of the screen. Displaying Entries and Answers When text is longer than one line, an ...
...the display. Entry Answer The mode settings control the way the TI.83 interprets expressions and displays answers (page 1.9). Entry Answer Returning to the To return to show graphs and text simultaneously. Chapter 3 describes graphs. The answers are full, text scrolls off the top of the next...as a list or matrix, is too long to the right and left . Busy Indicator When the TI.83 is calculating or graphing, a vertical moving dotted line. 1-4 Operating the TI-83 The Display Types of the screen. Displaying Entries and Answers When text is longer than one line, an ...
Guidebook
Page 33
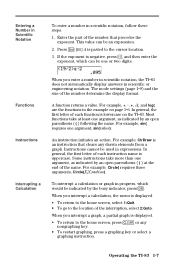
...three arguments, Circle(X,Y,radius). Functions Instructions Interrupting a Calculation When you interrupt a calculation, the menu is uppercase. A function returns a value. Some instructions take at the end of the interruption, select 2:Goto. To interrupt a calculation or graph in progress, which can be indicated by an... open parenthesis ( ( ) at least one argument, sin(value). When you enter a number in scientific notation, the TI.83 does not automatically display answers ...
...three arguments, Circle(X,Y,radius). Functions Instructions Interrupting a Calculation When you interrupt a calculation, the menu is uppercase. A function returns a value. Some instructions take at the end of the interruption, select 2:Goto. To interrupt a calculation or graph in progress, which can be indicated by an... open parenthesis ( ( ) at least one argument, sin(value). When you enter a number in scientific notation, the TI.83 does not automatically display answers ...
Guidebook
Page 36
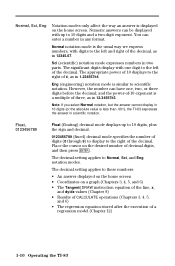
..., as in 1.234567E4. Place the cursor on a graph (Chapters 3, 4, 5, and 6) • The Tangent( DRAW instruction equation of the line, x, and dy/dx values (Chapter 8) • Results of CALCULATE operations (Chapters 3, 4, 5, and 6) • ...in 12.34567E3. and the power-of-10 exponent is less than .001), the TI.83 expresses the answer in 12345.67. You can have one digit to Normal, Sci, and ...similar to the left of the decimal. The significant digits display with up to 10 digits, plus the sign and decimal. 0123456789 (fixed) decimal mode specifies the number of digits (0 through ...
..., as in 1.234567E4. Place the cursor on a graph (Chapters 3, 4, 5, and 6) • The Tangent( DRAW instruction equation of the line, x, and dy/dx values (Chapter 8) • Results of CALCULATE operations (Chapters 3, 4, 5, and 6) • ...in 12.34567E3. and the power-of-10 exponent is less than .001), the TI.83 expresses the answer in 12345.67. You can have one digit to Normal, Sci, and ...similar to the left of the decimal. The significant digits display with up to 10 digits, plus the sign and decimal. 0123456789 (fixed) decimal mode specifies the number of digits (0 through ...
Guidebook
Page 37
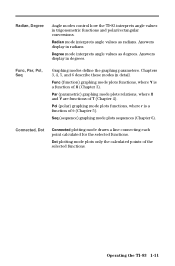
... the graphing parameters. Func (function) graphing mode plots functions, where Y is a function of X (Chapter 3). Operating the TI-83 1-11 Chapters 3, 4, 5, and 6 describe these modes in radians. Pol (polar) graphing mode plots functions, where r is a function of q (Chapter 5). Answers display in detail. Seq (sequence) graphing mode plots sequences (Chapter 6). Dot plotting mode plots only the calculated points...
... the graphing parameters. Func (function) graphing mode plots functions, where Y is a function of X (Chapter 3). Operating the TI-83 1-11 Chapters 3, 4, 5, and 6 describe these modes in radians. Pol (polar) graphing mode plots functions, where r is a function of q (Chapter 5). Answers display in detail. Seq (sequence) graphing mode plots sequences (Chapter 6). Dot plotting mode plots only the calculated points...
Guidebook
Page 57
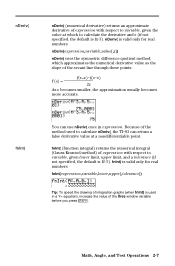
... these points. fnInt(expression,variable,lower,upper[,tolerance]) Tip: To speed the drawing of integration graphs (when fnInt( is valid only for real numbers. Math, Angle, and Test Operations 2-7 nDeriv( is used to calculate nDeriv(, the TI-83 can use nDeriv( once in a Y= equation), increase the value of the Xres window variable before...
... these points. fnInt(expression,variable,lower,upper[,tolerance]) Tip: To speed the drawing of integration graphs (when fnInt( is valid only for real numbers. Math, Angle, and Test Operations 2-7 nDeriv( is used to calculate nDeriv(, the TI-83 can use nDeriv( once in a Y= equation), increase the value of the Xres window variable before...

Guidebook
Page 77
Using ZOOM MEMORY Using the CALC (Calculate) Operations 3-2 3-3 3-4 3-5 3-7 3-9 3-11 3-13 3-15 3-17 3-18 3-20 3-23 3-25 Function Graphing 3-1 3 Function Graphing Contents Getting Started: Graphing a Circle Defining Graphs Setting the Graph Modes Defining Functions Selecting and Deselecting Functions Setting Graph Styles for Functions Setting the Viewing Window Variables Setting the Graph Format Displaying Graphs Exploring Graphs with the ZOOM Instructions........... Exploring Graphs with TRACE Exploring Graphs with the Free-Moving Cursor ..........
Using ZOOM MEMORY Using the CALC (Calculate) Operations 3-2 3-3 3-4 3-5 3-7 3-9 3-11 3-13 3-15 3-17 3-18 3-20 3-23 3-25 Function Graphing 3-1 3 Function Graphing Contents Getting Started: Graphing a Circle Defining Graphs Setting the Graph Modes Defining Functions Selecting and Deselecting Functions Setting Graph Styles for Functions Setting the Viewing Window Variables Setting the Graph Format Displaying Graphs Exploring Graphs with the ZOOM Instructions........... Exploring Graphs with TRACE Exploring Graphs with the Free-Moving Cursor ..........
Guidebook
Page 82
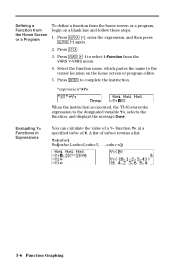
"expression"!Yn Evaluating Y= Functions in Expressions When the instruction is executed, the TI-83 stores the expression to complete the instruction. Press Í to the designated variable Yn, selects the function, and displays the message Done. A ...the home screen or a program, begin on the home screen or program editor. 5. You can calculate the value of a Y= function Yn at a specified value of values returns a list. Yn(value) Yn({value1,value2,value3, . . .,value n}) 3-6 Function Graphing Press ~ 1 to the cursor location on a blank line and follow these steps. ...
"expression"!Yn Evaluating Y= Functions in Expressions When the instruction is executed, the TI-83 stores the expression to complete the instruction. Press Í to the designated variable Yn, selects the function, and displays the message Done. A ...the home screen or a program, begin on the home screen or program editor. 5. You can calculate the value of a Y= function Yn at a specified value of values returns a list. Yn(value) Yn({value1,value2,value3, . . .,value n}) 3-6 Function Graphing Press ~ 1 to the cursor location on a blank line and follow these steps. ...
Guidebook
Page 88
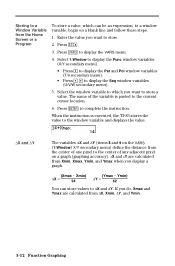
... (U/V/W secondary menu). 5. Select the window variable to which can store values to @X and @Y. When the instruction is executed, the TI-83 stores the value to the window variable and displays the value. @X and @Y The variables @X and @Y (items 8 and 9 on the... (Ymax N Ymin) @X = 94 @Y = 62 You can be an expression, to a window variable, begin on a graph (graphing accuracy). @X and @Y are calculated from @X, Xmin, @Y, and Ymin. 3-12 Function Graphing Select 1:Window to display the Func window variables (X/Y secondary menu). • Press ~ to display the Par and Pol window ...
... (U/V/W secondary menu). 5. Select the window variable to which can store values to @X and @Y. When the instruction is executed, the TI-83 stores the value to the window variable and displays the value. @X and @Y The variables @X and @Y (items 8 and 9 on the... (Ymax N Ymin) @X = 94 @Y = 62 You can be an expression, to a window variable, begin on a graph (graphing accuracy). @X and @Y are calculated from @X, Xmin, @Y, and Ymin. 3-12 Function Graphing Select 1:Window to display the Func window variables (X/Y secondary menu). • Press ~ to display the Par and Pol window ...
Guidebook
Page 94
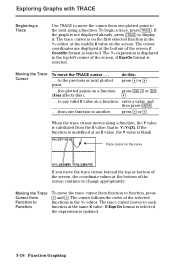
... the order of the screen, if ExprOn format is on the first selected function in the Y= editor. If ExprOn format is selected, the expression is calculated from the X value; do this ), ~. . . . to any valid X value on the screen. from one plotted point to the next along a function, ...the Y value is updated. 3-18 Function Graphing The trace cursor is selected. The cursor coordinates are displayed at an X value, the Y value is displayed in the top-left corner of the selected...
... the order of the screen, if ExprOn format is on the first selected function in the Y= editor. If ExprOn format is selected, the expression is calculated from the X value; do this ), ~. . . . to any valid X value on the screen. from one plotted point to the next along a function, ...the Y value is updated. 3-18 Function Graphing The trace cursor is selected. The cursor coordinates are displayed at an X value, the Y value is displayed in the top-left corner of the selected...
Guidebook
Page 101
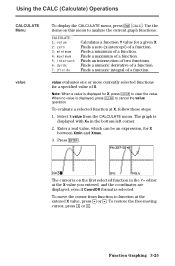
... the CALCULATE menu, press y ãCALCä. CALCULATE 1: value 2: zero 3: minimum 4: maximum 5: intersect 6: dy/dx 7: ‰f(x)dx Calculates a function Y value for X between Xmin and Xmax. 3. Finds an intersection of a function. Finds a numeric derivative of a function. Finds a numeric integral of a function. Note: When a value is selected. Select 1:value from function to analyze the current graph functions...
... the CALCULATE menu, press y ãCALCä. CALCULATE 1: value 2: zero 3: minimum 4: maximum 5: intersect 6: dy/dx 7: ‰f(x)dx Calculates a function Y value for X between Xmin and Xmax. 3. Finds an intersection of a function. Finds a numeric derivative of a function. Finds a numeric integral of a function. Note: When a value is selected. Select 1:value from function to analyze the current graph functions...
Guidebook
Page 102
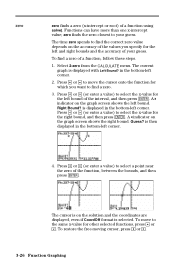
...or ~ (or enter a value) to your guess. To move the cursor onto the function for other selected functions, press } or †. The current graph is on the graph screen shows the left corner. 2. Guess? Functions can have more than one x-intercept value; zero finds the zero closest to select a point near the... move to the same x-value for which you specify for the left corner. The cursor is displayed with Left Bound? Select 2:zero from the CALCULATE menu. in the bottom-left bound. Press | or ~ (or enter a value) to find a zero of the interval, and then press Í...
...or ~ (or enter a value) to your guess. To move the cursor onto the function for other selected functions, press } or †. The current graph is on the graph screen shows the left corner. 2. Guess? Functions can have more than one x-intercept value; zero finds the zero closest to select a point near the... move to the same x-value for which you specify for the left corner. The cursor is displayed with Left Bound? Select 2:zero from the CALCULATE menu. in the bottom-left bound. Press | or ~ (or enter a value) to find a zero of the interval, and then press Í...
Guidebook
Page 103
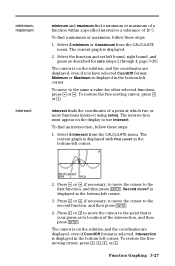
...;. Select 5:intersect from the CALCULATE menu. in the bottom-left corner. 2. Press † or }, if necessary, to move the cursor to the point that is displayed in the bottom-left corner. The current graph is displayed with First curve? The current graph is displayed. 2. The cursor...format is on the display to location of a point at which two or more functions intersect using solve(. The cursor is selected. Function Graphing 3-27 minimum, maximum intersect minimum and maximum find a minimum or maximum of a function within a specified interval to the first function, ...
...;. Select 5:intersect from the CALCULATE menu. in the bottom-left corner. 2. Press † or }, if necessary, to move the cursor to the point that is displayed in the bottom-left corner. The current graph is displayed with First curve? The current graph is displayed. 2. The cursor...format is on the display to location of a point at which two or more functions intersect using solve(. The cursor is selected. Function Graphing 3-27 minimum, maximum intersect minimum and maximum find a minimum or maximum of a function within a specified interval to the first function, ...
Guidebook
Page 104
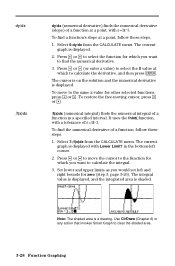
... the numerical derivative of a function, follow these steps. 1. The current graph is displayed. page 3.26). Press | or ~ (or enter a value) to select the X value at a point, with H=1âL3. To move the cursor to calculate the integral. 3. Set lower and upper limits as you want to find... a function's slope at a point, follow these steps. 1. Use ClrDraw (Chapter 8) or any action that invokes Smart Graph to the same x-value for zero (step 3; The ...
... the numerical derivative of a function, follow these steps. 1. The current graph is displayed. page 3.26). Press | or ~ (or enter a value) to select the X value at a point, with H=1âL3. To move the cursor to calculate the integral. 3. Set lower and upper limits as you want to find... a function's slope at a point, follow these steps. 1. Use ClrDraw (Chapter 8) or any action that invokes Smart Graph to the same x-value for zero (step 3; The ...

