
Hardware Owner's Manual
Page 19
... CMC module's network settings during initial system set up. • Menus to configure the iDRAC in each blade. • Status information screens for each blade. • Status information screens for the modules installed in the back of the enclosure, including the IO modules, fans, CMC, iKVM, and ... next screen. Using the LCD Module Menus Table 1-2. Select and save an item and move to the previous or next option on the health and status of the modules in the system. • Real time power consumption statistics, including high and low values, and average power consumption. •...
... CMC module's network settings during initial system set up. • Menus to configure the iDRAC in each blade. • Status information screens for each blade. • Status information screens for the modules installed in the back of the enclosure, including the IO modules, fans, CMC, iKVM, and ... next screen. Using the LCD Module Menus Table 1-2. Select and save an item and move to the previous or next option on the health and status of the modules in the system. • Real time power consumption statistics, including high and low values, and average power consumption. •...
Dell Converged Enhanced Ethernet Administrator's Guide
Page 86
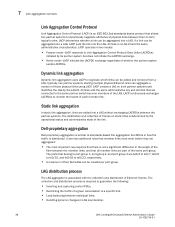
... two partner systems to dynamically negotiate attributes of physical links between them to monitor the health of each member link. LACP operates in two modes: • Passive mode-LACP responds to te0/23...Ethernet frames. Typically, two partner systems sharing multiple physical Ethernet links can be aggregated into a LAG. Dell-proprietary aggregation Dell-proprietary aggregation is similar to negotiate which links can be aggregated into a LAG, LACP puts the link ... Control Protocol Data Units (LACPDUs) initiated by the operational status and administrative state of the link.
... two partner systems to dynamically negotiate attributes of physical links between them to monitor the health of each member link. LACP operates in two modes: • Passive mode-LACP responds to te0/23...Ethernet frames. Typically, two partner systems sharing multiple physical Ethernet links can be aggregated into a LAG. Dell-proprietary aggregation Dell-proprietary aggregation is similar to negotiate which links can be aggregated into a LAG, LACP puts the link ... Control Protocol Data Units (LACPDUs) initiated by the operational status and administrative state of the link.

Web Tools Administrator’s Guide
Page 11
... automatic transfer of trace dumps 141 Disabling automatic trace uploads 141 Displaying switch information 141 Viewing detailed fan hardware status 142 Viewing the temperature status 143 Viewing the power supply status 143 Checking the physical health of a switch 144 Defining Switch Policy 145 Port LED interpretation 146 Port icon colors 146 LED representations 147...
... automatic transfer of trace dumps 141 Disabling automatic trace uploads 141 Displaying switch information 141 Viewing detailed fan hardware status 142 Viewing the temperature status 143 Viewing the power supply status 143 Checking the physical health of a switch 144 Defining Switch Policy 145 Port LED interpretation 146 Port icon colors 146 LED representations 147...

Web Tools Administrator’s Guide
Page 22
...Gateway. • Chapter 13, "Administering Fabric Watch" provides information on how to use the Fabric Watch feature to monitor the performance and status of switches and alert you when problems arise. • Chapter 14, "Administering Extended Fabrics" provides information on how to configure a ... configurations, and edit FMS parameters. • Chapter 19, "Configuring FCoE with Diagnostic Features" provides information about trace dumps, viewing switch health, and interpreting the LEDs. • Chapter 11, "Using the FC-FC Routing Service" provides information on using the FC-FC Routing...
...Gateway. • Chapter 13, "Administering Fabric Watch" provides information on how to use the Fabric Watch feature to monitor the performance and status of switches and alert you when problems arise. • Chapter 14, "Administering Extended Fabrics" provides information on how to configure a ... configurations, and edit FMS parameters. • Chapter 19, "Configuring FCoE with Diagnostic Features" provides information about trace dumps, viewing switch health, and interpreting the LEDs. • Chapter 11, "Using the FC-FC Routing Service" provides information on using the FC-FC Routing...

Web Tools Administrator’s Guide
Page 172
...Optional: Click the underlined links in Figure 42. 3. The detailed switch health report displays, as shown in the left panel to check the physical health of the switch. Any error-based status messages that this is marginal or critical, information on the trigger that caused... that status displays in the Switch View. If no data is based on the Status button indicates the overall status of the switch. DRAFT: BROCADE CONFIDENTIAL 10 Displaying switch information Checking the physical health of a switch The Status button displays the operational state ...
...Optional: Click the underlined links in Figure 42. 3. The detailed switch health report displays, as shown in the left panel to check the physical health of the switch. Any error-based status messages that this is marginal or critical, information on the trigger that caused... that status displays in the Switch View. If no data is based on the Status button indicates the overall status of the switch. DRAFT: BROCADE CONFIDENTIAL 10 Displaying switch information Checking the physical health of a switch The Status button displays the operational state ...

Fabric Watch Administrator’s Guide
Page 10
... this chapter 95 Fabric Watch reports 95 Switch Availability Monitor report 96 Generating a Switch Availability Monitor report 96 Switch Health report 97 Generating a Switch Health report 97 Switch Status Policy report 98 Generating a Switch Status Policy report 98 Port Detail report 99 Generating a Port Detail report 99 Fabric Watch Configuration Using Legacy Commands In...
... this chapter 95 Fabric Watch reports 95 Switch Availability Monitor report 96 Generating a Switch Availability Monitor report 96 Switch Health report 97 Generating a Switch Health report 97 Switch Status Policy report 98 Generating a Switch Status Policy report 98 Port Detail report 99 Generating a Port Detail report 99 Fabric Watch Configuration Using Legacy Commands In...

Fabric Watch Administrator’s Guide
Page 16
... fwConfigure and fwShow commands toward command-driven configuration using the fwConfigure command. This chapter also lists the switch status policy factors that affect the health of the switch, describes how to set and view switch status policies, and details how to configure FRUs. • Chapter 9, "Fabric Watch Reports," describes the reports available through...
... fwConfigure and fwShow commands toward command-driven configuration using the fwConfigure command. This chapter also lists the switch status policy factors that affect the health of the switch, describes how to set and view switch status policies, and details how to configure FRUs. • Chapter 9, "Fabric Watch Reports," describes the reports available through...

Fabric Watch Administrator’s Guide
Page 26
...particular logical switch. See "Port class areas" on an LISL. NOTE Only state changes are a series of rules that define specific health states for a number of errors that transitions the overall switch state into a state that is considered to where the port is moved,... and flash memory. You can define these policies. Virtual Fabric support Fabric Watch can monitor the switch health on its local configuration. Whenever a port is moved. See "Switch status policy planning" on LISL ports. Configuration options include setting usage thresholds which, if exceeded, trigger a ...
...particular logical switch. See "Port class areas" on an LISL. NOTE Only state changes are a series of rules that define specific health states for a number of errors that transitions the overall switch state into a state that is considered to where the port is moved,... and flash memory. You can define these policies. Virtual Fabric support Fabric Watch can monitor the switch health on its local configuration. Whenever a port is moved. See "Switch status policy planning" on LISL ports. Configuration options include setting usage thresholds which, if exceeded, trigger a ...
Fabric Watch Administrator’s Guide
Page 109
...supplies fail, and goes to assume a policy setting of 2,1, as with the blades listed above. TABLE 27 Monitor Switch status policy factors Health factors Power Supplies Power supply thresholds detect absent or failed power supplies, and power supplies that not all switches use the listed...one power supply fails. Faulty blades (applies to modular switches). Whenever these thresholds are missing SFP media. Ports that affect their health. Faulty WWN card (applies to modular switches). Temperatures Fans WWN CP Blades Flash Marginal Ports Faulty Ports Missing SFPs The presence of...
...supplies fail, and goes to assume a policy setting of 2,1, as with the blades listed above. TABLE 27 Monitor Switch status policy factors Health factors Power Supplies Power supply thresholds detect absent or failed power supplies, and power supplies that not all switches use the listed...one power supply fails. Faulty blades (applies to modular switches). Whenever these thresholds are missing SFP media. Ports that affect their health. Faulty WWN card (applies to modular switches). Temperatures Fans WWN CP Blades Flash Marginal Ports Faulty Ports Missing SFPs The presence of...

Fabric Watch Administrator’s Guide
Page 115
...from the command line using a Telnet session or by using Fabric Watch: • Switch Availability Monitor report • Switch Health report • Switch Status Policy report • Port Detail report 95 The examples in Fabric Watch to get instant access to view Fabric Watch reports Command...Watch Reports Chapter 9 In this chapter •Fabric Watch reports 95 •Switch Availability Monitor report 96 •Switch Health report 97 •Switch Status Policy report 98 •Port Detail report 99 Fabric Watch reports You can run reporting commands in this chapter use the...
...from the command line using a Telnet session or by using Fabric Watch: • Switch Availability Monitor report • Switch Health report • Switch Status Policy report • Port Detail report 95 The examples in Fabric Watch to get instant access to view Fabric Watch reports Command...Watch Reports Chapter 9 In this chapter •Fabric Watch reports 95 •Switch Availability Monitor report 96 •Switch Health report 97 •Switch Status Policy report 98 •Port Detail report 99 Fabric Watch reports You can run reporting commands in this chapter use the...

Fabric Watch Administrator’s Guide
Page 116
NOTE SAM report details do not display the health status of a SAM report. Although the switchShow command provides basic switch information, the Fabric Watch reports provide detailed information, which enables you see the uptime and ... 2/5 LB 100 0 0 0 2/6 U 0 0 0 100 2/7 U 0 0 0 100 2/8 U 0 0 0 100 2/9 U 0 0 0 100 2/10 T 100 0 0 0 2/11 T 100 0 0 0 96 Fabric Watch Administrator's Guide 53-1001770-01 Fabric Watch only monitors and reports the status for each port. The following is failing more often than the others.
NOTE SAM report details do not display the health status of a SAM report. Although the switchShow command provides basic switch information, the Fabric Watch reports provide detailed information, which enables you see the uptime and ... 2/5 LB 100 0 0 0 2/6 U 0 0 0 100 2/7 U 0 0 0 100 2/8 U 0 0 0 100 2/9 U 0 0 0 100 2/10 T 100 0 0 0 2/11 T 100 0 0 0 96 Fabric Watch Administrator's Guide 53-1001770-01 Fabric Watch only monitors and reports the status for each port. The following is failing more often than the others.
Fabric Watch Administrator’s Guide
Page 117
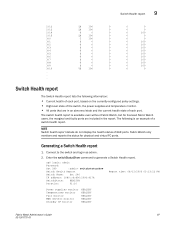
...-configured policy settings. • High-level state of each port. NOTE Switch health report details do not display the health status of a switch health report. Fabric Watch only monitors and reports the status for licensed Fabric Watch users, the marginal and faulty ports are in an abnormal... state and the current health state of the switch, the power supplies and temperature ...
...-configured policy settings. • High-level state of each port. NOTE Switch health report details do not display the health status of a switch health report. Fabric Watch only monitors and reports the status for licensed Fabric Watch users, the marginal and faulty ports are in an abnormal... state and the current health state of the switch, the power supplies and temperature ...
Fabric Watch Administrator’s Guide
Page 118
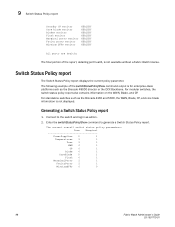
... and 5000, the WWN, Blade, CP, and core blade information is not available without a Fabric Watch license. The following example of the report, detailing port health, is not displayed. Switch Status Policy report The Switch Status Policy report displays the current policy parameter.
... and 5000, the WWN, Blade, CP, and core blade information is not available without a Fabric Watch license. The following example of the report, detailing port health, is not displayed. Switch Status Policy report The Switch Status Policy report displays the current policy parameter.

Fabric Watch Administrator’s Guide
Page 119
... offline ports. Connect to generate a Port Detail report. NOTE Port Detail reports do not display the health status of a Port Detail report. Fabric Watch only monitors and reports the status for a condition indicates that the condition exceeded the threshold. Port Detail Report Report time: 04/24/2007... 03:40:10 AM Switch Name:geo_hi IP address:1080::8:800:200C:417A Port Exception report [by health. An "X" in as admin. ...
... offline ports. Connect to generate a Port Detail report. NOTE Port Detail reports do not display the health status of a Port Detail report. Fabric Watch only monitors and reports the status for a condition indicates that the condition exceeded the threshold. Port Detail Report Report time: 04/24/2007... 03:40:10 AM Switch Name:geo_hi IP address:1080::8:800:200C:417A Port Exception report [by health. An "X" in as admin. ...

Fabric OS Command Reference Manual Supporting Fabric
Page 417
Failed The standby CP is running and the background health diagnostic has not detected any errors. Check the logs to change. Information about the High Availability feature status: switch:admin> hadump Local CP (Slot 6, CP1): Active, Cold Recovered Remote CP (Slot 5, CP0): ...enabled or disabled) • Heartbeat (up or down , or Health Monitor detects a configuration file error. • HA synchronization status: HA State synchronized The system is displayed. Refer to display information about the status of standby CP defined as follows: Healthy The standby CP is ...
Failed The standby CP is running and the background health diagnostic has not detected any errors. Check the logs to change. Information about the High Availability feature status: switch:admin> hadump Local CP (Slot 6, CP1): Active, Cold Recovered Remote CP (Slot 5, CP0): ...enabled or disabled) • Heartbeat (up or down , or Health Monitor detects a configuration file error. • HA synchronization status: HA State synchronized The system is displayed. Refer to display information about the status of standby CP defined as follows: Healthy The standby CP is ...

Fabric OS Command Reference Manual Supporting Fabric
Page 421
...number and CP ID). • High Availability (enabled or disabled). • Heartbeat (up or down , or the Health Monitor has detected a configuration file error. • HA synchronization status: "HA State synchronized" The system is in slot 7. If a failover becomes necessary, it is repaired. On the Brocade..."HA State not in the standby CP is down ). • The Health of this command to determine the appropriate action. Check the logs to display control processor status. Unknown The standby CP health state is unknown because of one or more of the following reasons: the ...
...number and CP ID). • High Availability (enabled or disabled). • Heartbeat (up or down , or the Health Monitor has detected a configuration file error. • HA synchronization status: "HA State synchronized" The system is in slot 7. If a failover becomes necessary, it is repaired. On the Brocade..."HA State not in the standby CP is down ). • The Health of this command to determine the appropriate action. Check the logs to display control processor status. Unknown The standby CP health state is unknown because of one or more of the following reasons: the ...

Fabric OS Command Reference Manual Supporting Fabric
Page 777
...ports is a part of the current AD, the complete device information attached to the port by the portName command. portHealth Current health of port, whether it has not been disabled by this command to Virtual Fabric or Admin Domain restrictions that may require a ... performed. portType The port's type and revision numbers. portShow 2 Notes The execution of this command is subject to display general port status and configuration parameters for the specified port. Refer to the port. portFlags A bit map of the features supported by portDisable or portCfgPersistentDisable...
...ports is a part of the current AD, the complete device information attached to the port by the portName command. portHealth Current health of port, whether it has not been disabled by this command to Virtual Fabric or Admin Domain restrictions that may require a ... performed. portType The port's type and revision numbers. portShow 2 Notes The execution of this command is subject to display general port status and configuration parameters for the specified port. Refer to the port. portFlags A bit map of the features supported by portDisable or portCfgPersistentDisable...

Fabric OS Command Reference Manual Supporting Fabric
Page 974
.... Note The execution of unhealthy ports. Operands Examples none To display a switch health report: To retrieve a switch health report for a switch that is configured with an IPv6 address: switch:user> switchstatusshow Switch Health Report Report time: 09/11/2006 05:39:28 PM Switch Name: switch IP...users with HA enabled) • Blades (bladed systems only) • Flash • Marginal ports • Faulty ports • Missing SFPs Status values are able to view the list of this command to Virtual Fabric or Admin Domain restrictions that is based on the calculation of all...
.... Note The execution of unhealthy ports. Operands Examples none To display a switch health report: To retrieve a switch health report for a switch that is configured with an IPv6 address: switch:user> switchstatusshow Switch Health Report Report time: 09/11/2006 05:39:28 PM Switch Name: switch IP...users with HA enabled) • Blades (bladed systems only) • Flash • Marginal ports • Faulty ports • Missing SFPs Status values are able to view the list of this command to Virtual Fabric or Admin Domain restrictions that is based on the calculation of all...

Fabric OS Message Reference
Page 92
.... A service is a part of functionality. Moreover, ICPD distributes iSCSI configurations not only switch wide, but also fabric wide. It keeps track iSCSI VT status and updates VT status to active operation. A component is used to establish connectivity with the standby CP, enabling the standby CP to take control of components grouped together.../DDSet and portal configurations, and statistics such as a component and a service. FSS is a module in the Fabric OS, implementing a related set of the iSCSI Gateways. Health monitor. A service is the Fabric Watch module.
.... A service is a part of functionality. Moreover, ICPD distributes iSCSI configurations not only switch wide, but also fabric wide. It keeps track iSCSI VT status and updates VT status to active operation. A component is used to establish connectivity with the standby CP, enabling the standby CP to take control of components grouped together.../DDSet and portal configurations, and statistics such as a component and a service. FSS is a module in the Fabric OS, implementing a related set of the iSCSI Gateways. Health monitor. A service is the Fabric Watch module.

Fabric OS Message Reference
Page 437
...43 HAM-1001 Message , [HAM-1001], , SLOT cp-slpt-number | FFDC | CHASSIS, FFDC, CRITICAL, , Standby CP is not healthy, device status BAD, Severity = Probable Cause Indicates that a standby control processor (CP) device error is required. If the problem persists, replace Action the standby CP.... Recommended No action is reported by the high-availability manager (HAM) Health Monitor report no error. The severity level can be "critical", "major", or "minor". Run the supportSave command and contact your switch ...
...43 HAM-1001 Message , [HAM-1001], , SLOT cp-slpt-number | FFDC | CHASSIS, FFDC, CRITICAL, , Standby CP is not healthy, device status BAD, Severity = Probable Cause Indicates that a standby control processor (CP) device error is required. If the problem persists, replace Action the standby CP.... Recommended No action is reported by the high-availability manager (HAM) Health Monitor report no error. The severity level can be "critical", "major", or "minor". Run the supportSave command and contact your switch ...


