User Guide
Page 49
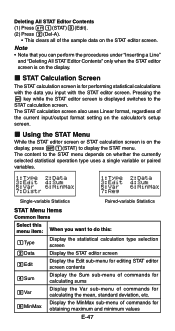
... STAT editor screen contents Display the Sum sub-menu of commands for calculating sums Display the Var sub-menu of commands for calculating the mean, standard deviation, etc. k Using the STAT Menu While the STAT editor screen or STAT calculation screen is for obtaining maximum and minimum values E-47 k STAT Calculation Screen...
... STAT editor screen contents Display the Sum sub-menu of commands for calculating sums Display the Var sub-menu of commands for calculating the mean, standard deviation, etc. k Using the STAT Menu While the STAT editor screen or STAT calculation screen is for obtaining maximum and minimum values E-47 k STAT Calculation Screen...
User Guide
Page 50
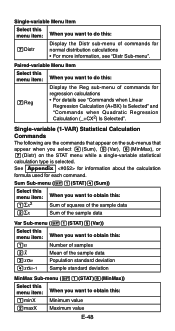
... this menu item: When you want to obtain this: 1n 2o 3xσn 4xσn-1 Number of samples Mean of the sample data Population standard deviation Sample standard deviation MinMax Sub-menu (11(STAT)6(MinMax)) Select this menu item: 1minX 2maxX When you want to do this: 7Distr Display the Distr sub-menu of...
... this menu item: When you want to obtain this: 1n 2o 3xσn 4xσn-1 Number of samples Mean of the sample data Population standard deviation Sample standard deviation MinMax Sub-menu (11(STAT)6(MinMax)) Select this menu item: 1minX 2maxX When you want to do this: 7Distr Display the Distr sub-menu of...
User Guide
Page 51
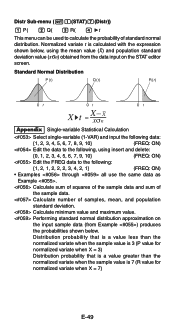
Calculate sum of squares of the sample data and sum of standard normal distribution. Calculate number of samples, mean value (o) and population standard deviation value (xσn) obtained from Example ) produces the probabilities shown below , using insert and delete: {0, 1, 2, 3, 4, 5, 6, 7, 9, 10} (FREQ: ON) Edit the FREQ data to the following: {1, 2, 1, 2, 2, 2, 3, 4, 2, 1}...value for normalized variate when X = 7) E-49 Distr Sub-menu (11(STAT)7(Distr)) 1 P( 2 Q( 3 R( 4 't This menu can be used to the following, using the mean , and population standard deviation.
Calculate sum of squares of the sample data and sum of standard normal distribution. Calculate number of samples, mean value (o) and population standard deviation value (xσn) obtained from Example ) produces the probabilities shown below , using insert and delete: {0, 1, 2, 3, 4, 5, 6, 7, 9, 10} (FREQ: ON) Edit the FREQ data to the following: {1, 2, 1, 2, 2, 2, 3, 4, 2, 1}...value for normalized variate when X = 7) E-49 Distr Sub-menu (11(STAT)7(Distr)) 1 P( 2 Q( 3 R( 4 't This menu can be used to the following, using the mean , and population standard deviation.
User Guide
Page 52
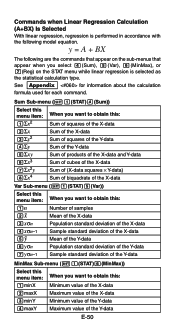
... 3xσn 4xσn-1 5p 6yσn 7yσn-1 Number of samples Mean of the X-data Population standard deviation of the X-data Sample standard deviation of the X-data Mean of the Y-data Population standard deviation of the Y-data Sample standard deviation of the Y-data E-50 Commands when Linear Regression Calculation (A+BX) Is Selected With linear regression, regression is...
... 3xσn 4xσn-1 5p 6yσn 7yσn-1 Number of samples Mean of the X-data Population standard deviation of the X-data Sample standard deviation of the X-data Mean of the Y-data Population standard deviation of the Y-data Sample standard deviation of the Y-data E-50 Commands when Linear Regression Calculation (A+BX) Is Selected With linear regression, regression is...
User Guide
Page 53
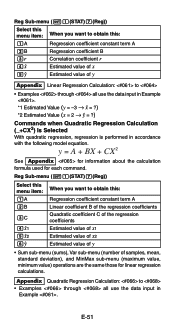
... want to obtain this : 1A Regression coefficient constant term A 2B Regression coefficient B 3r 4m 5n Correlation coefficient r Estimated value of x Estimated value of samples, mean, standard deviation), and MinMax sub-menu (maximum value, minimum value) operations are the same those for each command. Reg Sub-menu (11(STAT)7(Reg)) Select this menu...
... want to obtain this : 1A Regression coefficient constant term A 2B Regression coefficient B 3r 4m 5n Correlation coefficient r Estimated value of x Estimated value of samples, mean, standard deviation), and MinMax sub-menu (maximum value, minimum value) operations are the same those for each command. Reg Sub-menu (11(STAT)7(Reg)) Select this menu...


