User Guide
Page 49
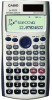
... on whether the currently selected statistical operation type uses a single variable or paired variables. Display the MinMax sub-menu of commands for calculating the mean, standard deviation, etc. The content to display the STAT menu. Note • Note that you want to the STAT calculation screen. The STAT calculation screen also uses...
... on whether the currently selected statistical operation type uses a single variable or paired variables. Display the MinMax sub-menu of commands for calculating the mean, standard deviation, etc. The content to display the STAT menu. Note • Note that you want to the STAT calculation screen. The STAT calculation screen also uses...
User Guide
Page 50
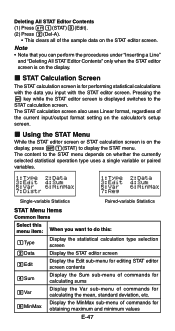
...)) Select this menu item: When you want to obtain this: 1n 2o 3xσn 4xσn-1 Number of samples Mean of the sample data Population standard deviation Sample standard deviation MinMax Sub-menu (11(STAT)6(MinMax)) Select this menu item: 1minX 2maxX When you want to obtain this : 7Distr Display the Distr sub-menu...
...)) Select this menu item: When you want to obtain this: 1n 2o 3xσn 4xσn-1 Number of samples Mean of the sample data Population standard deviation Sample standard deviation MinMax Sub-menu (11(STAT)6(MinMax)) Select this menu item: 1minX 2maxX When you want to obtain this : 7Distr Display the Distr sub-menu...
User Guide
Page 51
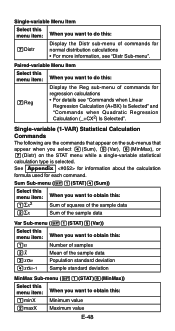
... Statistical Calculation Select single-variable (1-VAR) and input the following data: {1, 2, 3, 4, 5, 6, 7, 8, 9, 10} (FREQ: ON) Edit the data to the following, using the mean , and population standard deviation. Calculate minimum value and maximum value. Calculate number of samples, mean value (o) and population standard deviation value (xσn) obtained from Example ) produces the probabilities shown below.
... Statistical Calculation Select single-variable (1-VAR) and input the following data: {1, 2, 3, 4, 5, 6, 7, 8, 9, 10} (FREQ: ON) Edit the data to the following, using the mean , and population standard deviation. Calculate minimum value and maximum value. Calculate number of samples, mean value (o) and population standard deviation value (xσn) obtained from Example ) produces the probabilities shown below.
User Guide
Page 52
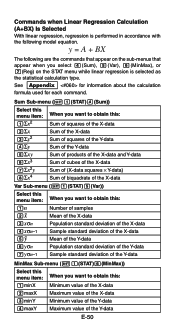
... 3xσn 4xσn-1 5p 6yσn 7yσn-1 Number of samples Mean of the X-data Population standard deviation of the X-data Sample standard deviation of the X-data Mean of the Y-data Population standard deviation of the Y-data Sample standard deviation of the Y-data MinMax Sub-menu (11(STAT)6(MinMax)) Select this menu item: When you select 4(Sum...
... 3xσn 4xσn-1 5p 6yσn 7yσn-1 Number of samples Mean of the X-data Population standard deviation of the X-data Sample standard deviation of the X-data Mean of the Y-data Population standard deviation of the Y-data Sample standard deviation of the Y-data MinMax Sub-menu (11(STAT)6(MinMax)) Select this menu item: When you select 4(Sum...
User Guide
Page 53
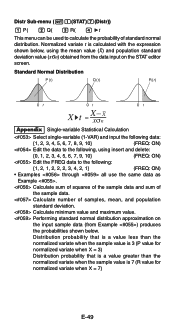
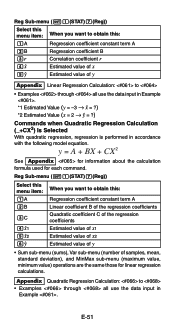
... want to obtain this : 1A Regression coefficient constant term A 2B Regression coefficient B 3r 4m 5n Correlation coefficient r Estimated value of x Estimated value of samples, mean, standard deviation), and MinMax sub-menu (maximum value, minimum value) operations are the same those for each command. Appendix Quadratic Regression Calculation: to • Examples through all...
... want to obtain this : 1A Regression coefficient constant term A 2B Regression coefficient B 3r 4m 5n Correlation coefficient r Estimated value of x Estimated value of samples, mean, standard deviation), and MinMax sub-menu (maximum value, minimum value) operations are the same those for each command. Appendix Quadratic Regression Calculation: to • Examples through all...


