Casio FX-CG10 Support Question
Casio FX-CG10 Support Question
Find answers below for this question about Casio FX-CG10.Need a Casio FX-CG10 manual? We have 2 online manuals for this item!
Question posted by Anonymous-143122 on September 8th, 2014
How To Fix The Graphing Setting
The person who posted this question about this Casio product did not include a detailed explanation. Please use the "Request More Information" button to the right if more details would help you to answer this question.
Current Answers
Answer #1: Posted by TechSupport101 on September 8th, 2014 8:42 PM
TechSupport101

Member since:
May 24th, 2013 Points: 12,171,305

Member since:
May 24th, 2013 Points: 12,171,305
Hi. See page 196 of the Software User Guide here
Related Casio FX-CG10 Manual Pages
Software User Guide - Page 4
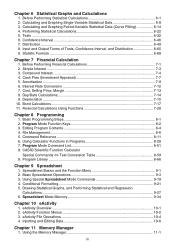
... and the Function Menu 9-1 2. Using the Memory Manager 11-1
iii Statistic Formula ...6-68
Chapter 7 Financial Calculation
1. Basic Spreadsheet Operations 9-3 3. Conditional Formatting 9-21 5. Chapter 6 Statistical Graphs and Calculations
1. Calculating and Graphing Single-Variable Statistical Data 6-8 3. Tests ...6-32 6. Input and Output Terms of Tests, Confidence Interval, and...
Software User Guide - Page 155
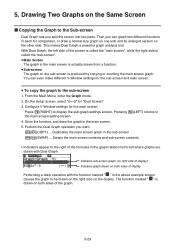
... display the sub-graph settings screen. Configure V-Window settings for "Dual Screen". 3. Store the function, and draw the graph in the sub-screen K2(SWAP) ...
This makes Dual Graph a powerful graph analysis tool.
From the Main Menu, enter the Graph mode. 2. On the Setup screen, select "G + G" for the main screen. Perform the Dual Graph operation you split the...
Software User Guide - Page 194
... can specify the multiple graphs. • {SET} ... {graph settings (graph type, list assignments)}
*1 The initial default graph type setting for tendencies. While the List Editor is scatter diagram, but you try to highlight the particular characteristics of the graph being drawn. Because of graph screen shots.
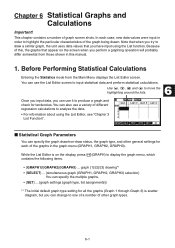
Chapter 6 Statistical Graphs and Calculations
Important!
This chapter...
Software User Guide - Page 195
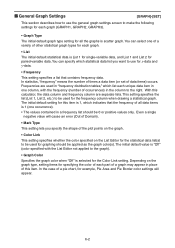
... of this calculator, the data column and frequency column are used for the frequency column when drawing a statistical graph. In the case of a pie chart, for example, Pie Area and Pie Border color settings will cause an error (Out of Domain).
• Mark Type
This setting lets you want to use the general graph settings screen...
Software User Guide - Page 196
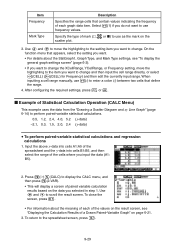
... type:
Selecting this:
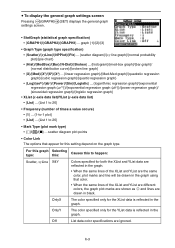
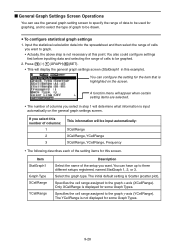
Causes this setting depend on the graph type. u To display the general graph settings screen
Pressing 1(GRAPH)6(SET) displays the general graph settings screen.
• StatGraph (statistical graph specification) • {GRAPH1}/{GRAPH2}/{GRAPH3} ... Off
List data color specifications are drawn in the graph.
• When the same lines of the XList and YList are...
Software User Guide - Page 201
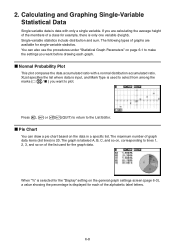
... general graph settings screen (page 6-3), a value showing the percentage is displayed for example, there is used for single-variable statistics. If you are available for the graph data. XList specifies the list where data is input, and Mark Type is only one variable (height). 2.
When "%" is data with a normal distribution accumulated ratio. Calculating and Graphing...
Software User Guide - Page 209
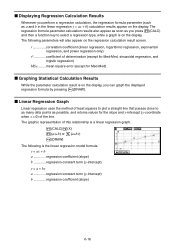
... press 1(CALC) and then a function key to
as many data points as possible, and returns values for Med-Med)
k Graphing Statistical Calculation Results
While the parameter calculation result is on the display, you can graph the displayed regression formula by pressing 6(DRAW). mean square error (except for the slope and y-intercept (y-coordinate when x = 0) of...
Software User Guide - Page 215

...these statistical values, see "Displaying the Calculation Results of a Drawn Single-Variable Graph", statistical calculation results were displayed after displaying a graph. location of single-variable statistic x...data and then press 2(CALC)6(SET). The following procedures can view variable characteristics. 4. Performing Statistical Calculations
All of variables used to perform and...
Software User Guide - Page 216

...+b)
The meanings of the parameters that appear on the meanings of these statistical values, see "Displaying the Calculation Results of a Drawn Paired-Variable Graph" (page 6-21).
For details on this , pressing f or c scrolls the statistical calculation result display so you can also be directly obtained by displaying the List Editor and pressing 2(CALC...
Software User Guide - Page 226
..., press 3(TEST) to specify the graph line color before graphing test calculation results.
1. Draws the graph.
Displays z score. The following graph analysis functions after drawing a Z Test result output graph. • 1(Z) ... t Tests ...and then press w. • V-Window settings are displayed in the graph (unless the location is off the graph screen). Pressing 1(Z) displays the z ...
Software User Guide - Page 271
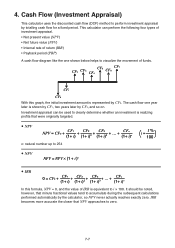
... for a fixed period.
CF2 CF3 CF4 CF5 CF6 CF7
CF1
CF0 With this formula, NPV = 0, and the value of IRR is realizing profits that were originally targeted. This calculator can be noted,
however, that NPV approaches to 254
I % i =
100
u NFV
NFV = NPV × (1 + i )n
u IRR
0 = CF0 + CF1 + CF2 + CF3 + ... + CFn
(1+ i) (1+ i)2 (1+ i)3
(1+ i)n
In this graph, the...
Software User Guide - Page 378
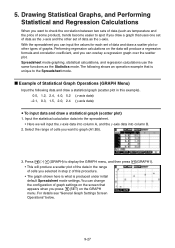
... following shows an operation example that is produced under initial default Spreadsheet mode settings. For details see "General Graph Settings Screen Operations" below.
9-27 Drawing Statistical Graphs, and Performing Statistical and Regression Calculations
When you want to check the correlation between two sets of data (such as temperature and the price of some product), trends become...
Software User Guide - Page 379
... this point. Specifies the cell range assigned to the graph x-axis (XCellRange). Press 6(g)1(GRAPH)6(SET). • This will determine what information is highlighted on the general graph settings screen.
You can use the general graph setting screen to specify the range of graph to be graphed.
2.
Input the statistical calculation data into the spreadsheet and then select the range...
Software User Guide - Page 380
... the y-data into cells B1:B5, and then
select the range of paired variable calculation results based on page 6-21.
3. To close the screen, press J.
• For information about the StatGraph1, Graph Type, and Mark Type settings, see "Displaying the Calculation Results of mark (ٗ, , or ) to display the CALC menu, and then...
Software User Guide - Page 382
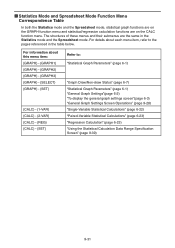
...information about each menu item, refer to :
"Statistical Graph Parameters" (page 6-1)
"Graph Draw/Non-draw Status" (page 6-7) "Statistical Graph Parameters" (page 6-1) "General Graph Settings"(page 6-2) "To display the general graph settings screen"(page 6-3) "General Graph Settings Screen Operations" (page 9-28) "Single-Variable Statistical Calculations" (page 6-22) "Paired-Variable Statistical...
Software User Guide - Page 444
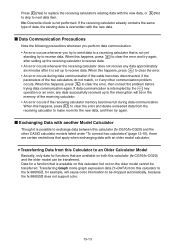
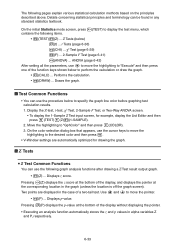
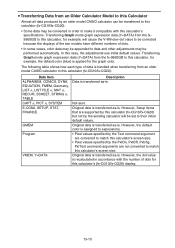
...Data with another Model Calculator
Though it is set up to the interruption will cause color information to exchange data between this calculator to make room for...data. Transferring Graph mode graph expression data (Y=DATA) from this calculator (fx-CG10/fx-CG20) and the other communication problem occurs.
u Transferring Data from the receiving calculator to
the fx-9860GII, for...
Software User Guide - Page 445
...that are supported by this calculator (fx-CG10/fx-CG20) to an older model CASIO calculator. Setup items that includes these commands on the receiving calculator.
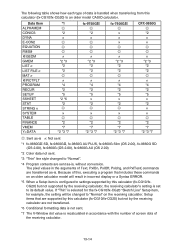
The following table shows how each type of data is handled when transferring from this calculator (fx-CG10/fx-CG20) but not supported by the receiving calculator, the receiving calculator's setting is set to its default value...
Software User Guide - Page 446
Transferring Graph mode graph expression data (Y=DATA) from an older model CASIO calculator to this calculator (fx-CG10/fx-CG20).
However, Setup items that are not converted to their initial default values. However, the default color is applied for example, will be set to match this calculator's screen size. In this calculator, for
example, the default color (blue) is assigned ...
Software User Guide - Page 572
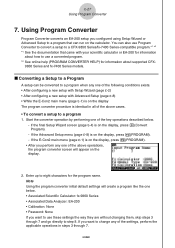
...) for information
about how to step 8. Note Using the program converter initial default settings will appear on the display, press 3(PROGRAM).
• After you want to change any one of the key operations described below . • Associated Scientific Calculator: fx-9860 Series • Associated Data Analyzer: EA-200 • Calibration: None • Password...
Software User Guide - Page 573
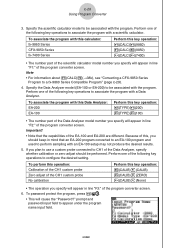
.... Perform one of the following key operations to be associated with this calculator: fx-9860 Series CFX-9850 Series fx-7400 Series
Perform this , you should be associated with an EA-100...F3:" of the EA-100 and EA-200 are different. Specify the scientific calculator model to configure the desired setting. Note
• For information about 1(CALC)4(→38k), see "Converting a...
Similar Questions


How Do You Change The Answer Setting On A Casio Scientific Calculator Fx-300es
plus
plus
(Posted by Kinlulu23 9 years ago)

Casio Graphing Calculator Fx-9750gii How To Put In Degree Mode
(Posted by highgFishf 9 years ago)

Casio Fx-cg10 Graphing Calculator How To Graph An Absolute Value Function
(Posted by ADEzophar 10 years ago)
How To Fix Invalid Setting?
when one inputs equations to graph and the pressing draw my calculator says invalid setting. how can...
when one inputs equations to graph and the pressing draw my calculator says invalid setting. how can...
(Posted by rubrubygr1 11 years ago)