
Casio FX-CG10 Support Question
Casio FX-CG10 Support Question
Find answers below for this question about Casio FX-CG10.Need a Casio FX-CG10 manual? We have 2 online manuals for this item!
Question posted by rubrubygr1 on October 30th, 2012
How To Fix Invalid Setting?
when one inputs equations to graph and the pressing draw my calculator says invalid setting. how can i fix that?
Current Answers
Related Casio FX-CG10 Manual Pages
Software User Guide - Page 9

... one you need quickly and easily.
and then a, the keyboard locks in alpha input until you press a and then a key to input an alphabetic character, the keyboard reverts to perform the marked function.
• Alpha Lock
Normally, once you press a again.
1-2 Press a and then the key to its primary functions immediately. Color Yellow
Red
Key...
Software User Guide - Page 19
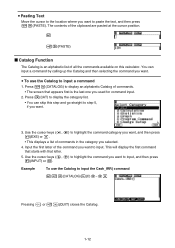
...) closes the Catalog.
1-12
Press 6(CAT) to display the category list. • You can input a command by calling up the Catalog and then selecting the command you want. u Pasting Text
Move the cursor to the location where you want to step 5, if you want.
3. You can skip this calculator. This will display the...
Software User Guide - Page 25

....
• In the Math input/output mode, pressing the D key always performs a backspace operation.
1-18 u Editing Calculations in the Math Input/Output Mode
The procedures for more information, see "Editing Calculations" (page 1-7). See page 1-7 for editing calculations in the Math input/output mode are different between the Math input/output mode and the Linear input/output mode.
•...
Software User Guide - Page 26

... the beginning Move the cursor from the beginning of the calculation to the end
Press this key: e d
k Using Undoing and Redoing Operations
You can use while inputting a calculation with Math input/output mode. If you press e during calculation expression input in the Math input/ output mode (up until you press the w key) to undo the last key operation and to...
Software User Guide - Page 40
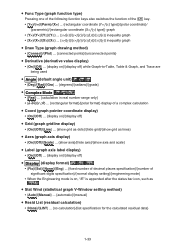
u Func Type (graph function type)
Pressing one of the following function keys also switches the function of the v key.
• {Y=}/{r=}/{Parm}/{X=} ... {rectangular coordinate (Y= f (x) type)}/{polar coordinate}/ {parametric}/{rectangular coordinate (X= f (y) type)} graph
• {Y>}/{Yf(x)}/{y}/{Xf(y)}/{x
Software User Guide - Page 112

...character color you want to change the data color in a specific cell
1.
Press !f(FORMAT) to the left of the data input in a particular list. u To change . • Be sure to...already contains input data. • The following operation displays a sub name in the Run-Matrix mode. !m(SET UP)2(Line)J
!b(List) n!+( [ )a!-( ] )w (n = list number from 1 to 26)
• Though you can input up to ...
Software User Guide - Page 157

... θ-1
• sin-1 θ • cosh θ • tanh-1 θ • lnθ • 3'θ
- Example
Graph y = 2x2 + 3x - 4.
On the Setup screen, change "Input/Output" setting to "Linear". 3.
Input for x and θ variables is not required for drawing the rectangular coordinate graph. 5. Use the following built-in function, other operators or values cannot be...
Software User Guide - Page 165
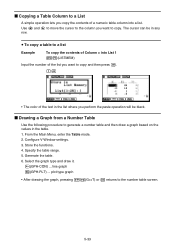
... 1
K1(LISTMEM)
Input the number of the list you want to copy. Use d and e to move the cursor to the column you want to copy and then press w. The cursor can be black. From the Main Menu, enter the Table mode. 2. Specify the table range. 5. Select the graph type and draw it.
5(GPH-CON...
Software User Guide - Page 182

... 6(g)6(g)2(Text) ... Text input 7. Configure V-Window settings. 3. Initial default color when drawing a plot, line, or text 4. Input the function of graphs. Horizontal line 6(g)6(g)1(PEN) ... Initial default line style when drawing a line • Plot/LineCol ... Tangent line 3(Norm) ... Circle 6(g)4(Vertical) ... Vertical line 6(g)5(Horz) ...
Press !f(FORMAT) to use...
Software User Guide - Page 187
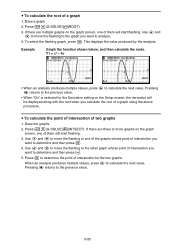
... value.
• When "On" is selected for the two graphs. Draw the graphs. 2. Use f and c to move the flashing to analyze. 4. u To calculate the root of two graphs
1. If there are three or more graphs on the graph
screen, one of a graph using the above procedure. To select the flashing graph, press w.
Use f and c to move the flashing to one...
Software User Guide - Page 189
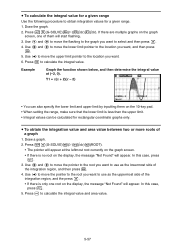
...range. 1. Press w to calculate the integral value.
u To calculate the integral value for a given range
Use the following procedure to use as the lowermost side of
the integration region, and then press w. 4. Draw the graph.
2. Y1 = x(x + 2)(x - 2)
• You can also specify the lower limit and upper limit by inputting them will appear. Press !5(G-SOLVE)6(g)3(∫...
Software User Guide - Page 190
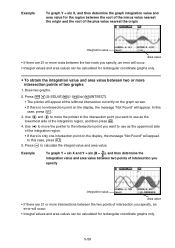
... move the pointer to the intersection point you want to calculate the integral value and area value. Use e to move the pointer to the intersection point you want to use as the uppermost side of the integration region, and then press w.
4. Draw two graphs.
2. Press w to use as the lowermost side of the integration region...
Software User Guide - Page 192

... the vertices of latus rectum for a hyperbolic graph, press e to calculate the second vertex. Pressing d will calculate the next value. An ellipse has four vertices.
5-60 Pressing d returns to the first focus.
• When calculating two vertexes for the parabola X = (Y - 2)2 + 3 Use the following V-Window settings. u To calculate the focus and length of latus rectum
Example...
Software User Guide - Page 222
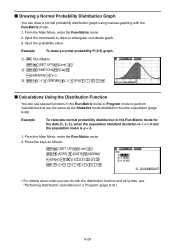
... Distribution Graph
You can draw a normal probability distribution graph using manual graphing with the distribution function and its syntax, see "Performing Distribution Calculations in a Program" (page 8-41).
6-29
Press the keys as the Statistics mode distribution function calculation (page 6-49). Input the commands to perform calculations that are the same as follows.
!m(SET UP...
Software User Guide - Page 244
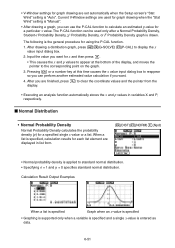
... graph, press !5(G-SOLVE) 1(P-CAL) to standard normal distribution.
• Specifying Ʊ = 1 and ƫ = 0 specifies standard normal distribution. Input the value you want . 4. When a
list is specified, calculation results for each list element are finished, press J to reappear
so you can be used for graph drawing when the "Stat Wind" setting is "Manual".
• After drawing a graph...
Software User Guide - Page 381

...used for variable x and
Frequency values when performing single-variable statistical calculations. After configuring the required settings, press J or w.
9-30 u To specify the data range for variable x, variable y,
and Frequency values when performing paired-variable statistical calculations.
3. Input the statistical calculation data into the spreadsheet and then select its range of the...
Software User Guide - Page 394

... input up one set. • Note that numeric expressions and commands do not wrap.*1 Scroll arrows (]') will appear on the left and right sides of the calculation line...input. Such a calculation line can use the left and right cursor keys to 255 bytes of math lines. A calculation line and its result make up to scroll the calculation.
10-7 Pressing 3(CALC) will change the calculation...
Software User Guide - Page 522

...
• You can specify your own expressions and graph them. See "Inputting an Expression of the Form Y=f(x) and Graphing It"
(page 15-10) for example, press 3(X2). To draw a regression graph, press 6(DRAW).
*1 For information about regression calculation types, see "Displaying Regression Calculation Results" (page 6-16) and the regression graph explanations on pages 6-16 through 6-20.
Software User Guide - Page 551

... two steps of the procedure under "To configure an EA-200 setup using
Setup Wizard" on the calculator.
• To configure a setup for sensors connected to +1.5.
7. Press 6(DRAW) to the View Window setting screen. • The following settings are configured automatically: Ymin = -1.5 and Ymax = 1.5. If you select [CASIO] - [Speaker] - [y=f(x)] on the "Select Sensor" screen, however...
Software User Guide - Page 590

... range on the form Y=f(x). Press 6(DRAW). • This draws a quadratic regression graph and overlays it is shared with the Graph mode. Because of the display.
2. Move the trace pointer to the start point of the range for which you want to perform quadratic regression, and then press w. • This displays the quadratic regression calculation result screen.
5. k Overlaying...
Similar Questions

Can This Calculator Solve Calculus And How.
(Posted by Mrdaye 4 months ago)

'invalid Type' Error Fx-cg20
Always when I try to execute a graph function, the calculator says invalid type (I have already rese...
Always when I try to execute a graph function, the calculator says invalid type (I have already rese...
(Posted by jellejacobe 6 years ago)

It Says 'invalid Setting' Whenever I Try To Graph Any Function.
I am not sure where or what I am supposed to change to make it work. I tried going into setup but i ...
I am not sure where or what I am supposed to change to make it work. I tried going into setup but i ...
(Posted by bieleckiandrzej 10 years ago)

Percent Button
Where and how do you calculate percentages on a fx-9860G slim casio graphing calculator?
Where and how do you calculate percentages on a fx-9860G slim casio graphing calculator?
(Posted by Anonymous-123652 10 years ago)