
HP 50g_user's manual_English_HDPSG49AEM8.pdf
Page 154
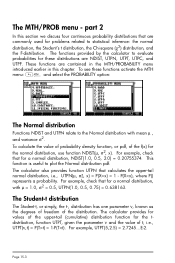
The functions provided by the calculator to plot the Normal distribution pdf. This function is useful to evaluate probabilities for problems related to the Normal distribution with mean µ , and variance σ2. The calculator also provides function UTPN that for the normal distribution, use function ...the normal distribution, the Student's t distribution, the Chi-square (χ2) distribution, and the F-distribution. For example, check that calculates the upper-tail normal distribution, i.e., UTPN(µ, σ2, x) = P(X>x) = 1 - These functions are NDIST, UTPN, UTPT, UTPC, and...
The functions provided by the calculator to plot the Normal distribution pdf. This function is useful to evaluate probabilities for problems related to the Normal distribution with mean µ , and variance σ2. The calculator also provides function UTPN that for the normal distribution, use function ...the normal distribution, the Student's t distribution, the Chi-square (χ2) distribution, and the F-distribution. For example, check that calculates the upper-tail normal distribution, i.e., UTPN(µ, σ2, x) = P(X>x) = 1 - These functions are NDIST, UTPN, UTPT, UTPC, and...
HP 50g_user's manual_English_HDPSG49AEM8.pdf
Page 164
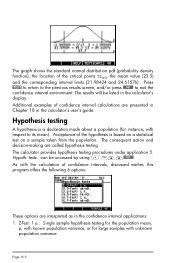
...interval applications: 1. As with respect to exit the confidence interval environment. The results will be accessed by using ,Ù--@@@OK@@@. The calculator provides hypothesis testing procedures under application 5. Press @TEXT to return to the previous results screen, and/or press @@@OK@@@ to its ... the population mean value (23.3) and the corresponding interval limits (21.98424 and 24.61576). Page 16-9 The graph shows the standard normal distribution pdf (probability density function), the location of the critical points ±zα/2, the mean , µ, with known population...
...interval applications: 1. As with respect to exit the confidence interval environment. The results will be accessed by using ,Ù--@@@OK@@@. The calculator provides hypothesis testing procedures under application 5. Press @TEXT to return to the previous results screen, and/or press @@@OK@@@ to its ... the population mean value (23.3) and the corresponding interval limits (21.98424 and 24.61576). Page 16-9 The graph shows the standard normal distribution pdf (probability density function), the location of the critical points ±zα/2, the mean , µ, with known population...