
Software User Guide
Page 34
... for paired-variable statistical estimated value, distribution, standard deviation, variance, and test functions} • {CONVERT} ... {metric conversion menu}* • {HYPERBL} ... {hyperbolic calculation menu} • {PROB} ... {probability/distribution calculation menu} • {NUMERIC} ... {numeric calculation menu} • {ANGLE} ... {menu for angle/coordinate conversion, sexagesimal input/conversion} • {ENG-SYM} ... {engineering symbol menu} •...
... for paired-variable statistical estimated value, distribution, standard deviation, variance, and test functions} • {CONVERT} ... {metric conversion menu}* • {HYPERBL} ... {hyperbolic calculation menu} • {PROB} ... {probability/distribution calculation menu} • {NUMERIC} ... {numeric calculation menu} • {ANGLE} ... {menu for angle/coordinate conversion, sexagesimal input/conversion} • {ENG-SYM} ... {engineering symbol menu} •...
Software User Guide
Page 36
... proportion}/{estimated proportion of sample 1}/{estimated proportion of sample 2}/{degrees of freedom} • {DIST} ... {distribution calculation results} • {p}/{xInv}/{x1Inv}/{x2Inv}/{zLow}/{zUp}/{tLow}/{tUp} ... {probability distribution or cumulative distribution calculation result (p-value)}/{inverse Student-t, χ2, F, binomial, Poisson, geometric or hypergeometric cumulative distribution calculation result}/{inverse normal cumulative distribution upper limit...
... proportion}/{estimated proportion of sample 1}/{estimated proportion of sample 2}/{degrees of freedom} • {DIST} ... {distribution calculation results} • {p}/{xInv}/{x1Inv}/{x2Inv}/{zLow}/{zUp}/{tLow}/{tUp} ... {probability distribution or cumulative distribution calculation result (p-value)}/{inverse Student-t, χ2, F, binomial, Poisson, geometric or hypergeometric cumulative distribution calculation result}/{inverse normal cumulative distribution upper limit...
Software User Guide
Page 60
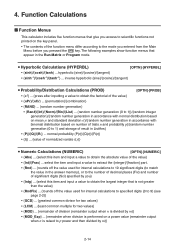
... the value} • {Int}/{Frac} ... u Hyperbolic Calculations (HYPERBL) [OPTN]-[HYPERBL] • {sinh}/{cosh}/{tanh} ... normal probability {P(t)}/{Q(t)}/{R(t)} • {t(} ... {value of normalized variate t(x)} u Numeric Calculations (NUMERIC) [OPTN]-[NUMERIC] • {Abs} ... {select... specified by m)} 2-14 hyperbolic {sine}/{cosine}/{tangent} • {sinh-1}/{cosh-1}/{tanh-1} ... inverse hyperbolic {sine}/{cosine}/{tangent} u Probability/Distribution Calculations (PROB) [OPTN]-[PROB] • {x!} ... {press after inputting a value to obtain the factorial of the value...
... the value} • {Int}/{Frac} ... u Hyperbolic Calculations (HYPERBL) [OPTN]-[HYPERBL] • {sinh}/{cosh}/{tanh} ... normal probability {P(t)}/{Q(t)}/{R(t)} • {t(} ... {value of normalized variate t(x)} u Numeric Calculations (NUMERIC) [OPTN]-[NUMERIC] • {Abs} ... {select... specified by m)} 2-14 hyperbolic {sine}/{cosine}/{tangent} • {sinh-1}/{cosh-1}/{tanh-1} ... inverse hyperbolic {sine}/{cosine}/{tangent} u Probability/Distribution Calculations (PROB) [OPTN]-[PROB] • {x!} ... {press after inputting a value to obtain the factorial of the value...
Software User Guide
Page 66
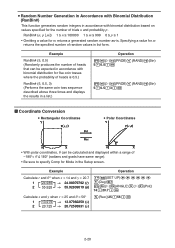
...in Accordance with Binomial Distribution (RanBin#) This function generates random integers in accordance with binomial distribution for five coin tosses where the probability of -180°< Ƨ < 180° (radians and grads have same range). • Be sure to specify Comp... for m returns the specified number of trials n and probability p. RanBin# (n, p [,m]) 1 < n < 100000 1 < m < 999 0 < p < 1 • Omitting a value for m returns a generated random number as-is 0.5.) RanBin# (5, 0.5,...
...in Accordance with Binomial Distribution (RanBin#) This function generates random integers in accordance with binomial distribution for five coin tosses where the probability of -180°< Ƨ < 180° (radians and grads have same range). • Be sure to specify Comp... for m returns the specified number of trials n and probability p. RanBin# (n, p [,m]) 1 < n < 100000 1 < m < 999 0 < p < 1 • Omitting a value for m returns a generated random number as-is 0.5.) RanBin# (5, 0.5,...
Software User Guide
Page 194
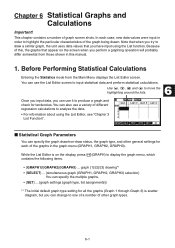
Before Performing Statistical Calculations Entering the Statistics mode from those shown in this , the graphs that when you perform a graphing operation will probably differ somewhat from the Main Menu displays the List Editor screen. k Statistical Graph Parameters You can also use a variety of the graph being drawn. You ...
Before Performing Statistical Calculations Entering the Statistics mode from those shown in this , the graphs that when you perform a graphing operation will probably differ somewhat from the Main Menu displays the List Editor screen. k Statistical Graph Parameters You can also use a variety of the graph being drawn. You ...
Software User Guide
Page 196
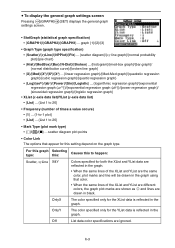
... (statistical graph specification) • {GRAPH1}/{GRAPH2}/{GRAPH3} ... graph {1}/{2}/{3} • Graph Type (graph type specification) • {Scatter}/{xyLine}/{NPPlot}/{Pie} ... {scatter diagram}/{xy line graph}/{normal probability plot}/{pie chart} • {Hist}/{MedBox}/{Bar}/{N-Dist}/{Broken} ... {histogram}/{med-box graph}/{bar graph}/ {normal distribution curve}/{broken line graph} • {X}/{Med}/{X2}/{X3...
... (statistical graph specification) • {GRAPH1}/{GRAPH2}/{GRAPH3} ... graph {1}/{2}/{3} • Graph Type (graph type specification) • {Scatter}/{xyLine}/{NPPlot}/{Pie} ... {scatter diagram}/{xy line graph}/{normal probability plot}/{pie chart} • {Hist}/{MedBox}/{Bar}/{N-Dist}/{Broken} ... {histogram}/{med-box graph}/{bar graph}/ {normal distribution curve}/{broken line graph} • {X}/{Med}/{X2}/{X3...
Software User Guide
Page 201
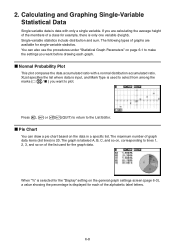
... 1, 2, 3, and so on page 6-1 to the List Editor. If you want before drawing each of a class for example, there is only one variable (height). k Normal Probability Plot This plot compares the data accumulated ratio with only a single variable. The maximum number of the list used to select from among the marks...
... 1, 2, 3, and so on page 6-1 to the List Editor. If you want before drawing each of a class for example, there is only one variable (height). k Normal Probability Plot This plot compares the data accumulated ratio with only a single variable. The maximum number of the list used to select from among the marks...

Software User Guide
Page 220
... • {t(} ... {obtains normalized variate t(x) value} • Normal probability P(t), Q(t), and R(t), and normalized variate t(x) are calculated using the following table shows the results of measurements of the ...college students. Height (cm) Frequency 1 158.5 1 2 160.5 1 3 163.3 2 4 167.5 2 5 170.2 3 Class no . k Normal Probability Distribution Calculation You can calculate normal probability distributions for single-variable statistics with the Run-Matrix mode. Standard Normal Distribution P (t) Q (t) R (t) 0t 0t 0t Example σx The following formulas. ...
... • {t(} ... {obtains normalized variate t(x) value} • Normal probability P(t), Q(t), and R(t), and normalized variate t(x) are calculated using the following table shows the results of measurements of the ...college students. Height (cm) Frequency 1 158.5 1 2 160.5 1 3 163.3 2 4 167.5 2 5 170.2 3 Class no . k Normal Probability Distribution Calculation You can calculate normal probability distributions for single-variable statistics with the Run-Matrix mode. Standard Normal Distribution P (t) Q (t) R (t) 0t 0t 0t Example σx The following formulas. ...

Software User Guide
Page 221
Press m, select the Run-Matrix mode, press K6(g)3(PROB) to recall the probability calculation (PROB) menu. 3(PROB)6(g)4(t() bga.f)w (Normalized variate t for 160.5 cm) 4(t() bhf.f)w (Normalized variate t for 175.5 cm) 1(P()a.ejg)1(P()-b.gde)w (Percentage of total) 3(R()a.ejg)w (Percentile) Result: -1.633855948 ( -1....
Press m, select the Run-Matrix mode, press K6(g)3(PROB) to recall the probability calculation (PROB) menu. 3(PROB)6(g)4(t() bga.f)w (Normalized variate t for 160.5 cm) 4(t() bhf.f)w (Normalized variate t for 175.5 cm) 1(P()a.ejg)1(P()-b.gde)w (Percentage of total) 3(R()a.ejg)w (Percentile) Result: -1.633855948 ( -1....
Software User Guide
Page 222
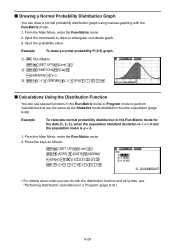
...GRAPH)1(Y=) 3 K6(g)3(PROB)6(g)1(P()a.f)w k Calculations Using the Distribution Function You can do with the Run-Matrix mode. 1. Example To calculate normal probability distribution in the Run-Matrix mode or Program mode to draw a rectangular coordinate graph. 3. From the Main Menu, enter the Run-...the keys as the Statistics mode distribution function calculation (page 6-49). From the Main Menu, enter the Run-Matrix mode. 2. Input the probability value. Input the commands to perform calculations that are the same as follows. !m(SET UP)2(Line)J K5(STAT)3(DIST)1(NORM) 1(Npd)!*( {...
...GRAPH)1(Y=) 3 K6(g)3(PROB)6(g)1(P()a.f)w k Calculations Using the Distribution Function You can do with the Run-Matrix mode. 1. Example To calculate normal probability distribution in the Run-Matrix mode or Program mode to draw a rectangular coordinate graph. 3. From the Main Menu, enter the Run-...the keys as the Statistics mode distribution function calculation (page 6-49). From the Main Menu, enter the Run-Matrix mode. 2. Input the probability value. Input the commands to perform calculations that are the same as follows. !m(SET UP)2(Line)J K5(STAT)3(DIST)1(NORM) 1(Npd)!*( {...

Software User Guide
Page 225
... χ2 GOF test (χ2 one dependent variable. ANOVA tests the hypothesis that is used for an unknown proportion of successes. 2-Prop Z Test tests to the probability of successes from previous tests. The hypothesis that the population means of sample variances. The t Test tests the hypothesis when the population standard deviation is...
... χ2 GOF test (χ2 one dependent variable. ANOVA tests the hypothesis that is used for an unknown proportion of successes. 2-Prop Z Test tests to the probability of successes from previous tests. The hypothesis that the population means of sample variances. The t Test tests the hypothesis when the population standard deviation is...

Software User Guide
Page 242
...other distribution shapes are also used to calculate the yield rate when manufacturing some product. For example, distribution can calculate the probability of the products will reach this value. 6-49 Conversely, a success rate target (80% for performing statistical calculations. ... parameter data specification items that are different from the List Editor. 4(INTR) 2(t) 2(2-SAMPLE) 7. Certain trends can calculate normal probability when estimating what percent of mean data (highest frequency), with the frequency decreasing as the criteria, you move away from a distribution...
...other distribution shapes are also used to calculate the yield rate when manufacturing some product. For example, distribution can calculate the probability of the products will reach this value. 6-49 Conversely, a success rate target (80% for performing statistical calculations. ... parameter data specification items that are different from the List Editor. 4(INTR) 2(t) 2(2-SAMPLE) 7. Certain trends can calculate normal probability when estimating what percent of mean data (highest frequency), with the frequency decreasing as the criteria, you move away from a distribution...

Software User Guide
Page 243
... values. On the color selection dialog box that represents the location within a normal distribution for a specific cumulative probability. Student-t probability density calculates t probability density from a specified x value. F distribution (page 6-56) 5(BINOMIAL) ... Draws the graph. Inverse Student...to display the distribution menu, which contains the following items. • 5(DIST)1(NORM) ... Normal cumulative distribution calculates the probability of a distribution calculation result, you can also be calculated for example, display the List Editor and then press 5(DIST)1(...
... values. On the color selection dialog box that represents the location within a normal distribution for a specific cumulative probability. Student-t probability density calculates t probability density from a specified x value. F distribution (page 6-56) 5(BINOMIAL) ... Draws the graph. Inverse Student...to display the distribution menu, which contains the following items. • 5(DIST)1(NORM) ... Normal cumulative distribution calculates the probability of a distribution calculation result, you can also be calculated for example, display the List Editor and then press 5(DIST)1(...
Software User Guide
Page 244
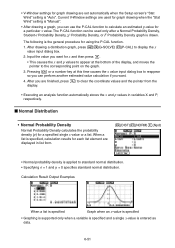
...x value. After you are used only after a Normal Probability Density, Student-t Probability Density, Ƶ2 Probability Density, or F Probability Density graph is drawn. k Normal Distribution • Normal Probability Density Normal Probability Density calculates the probability density (p) for x and then press w. • This... Executing an analysis function automatically stores the x and p values in list form. 5(DIST)1(NORM)1(Npd) • Normal probability density is applied to standard normal distribution. • Specifying Ʊ = 1 and ƫ = 0 specifies standard ...
...x value. After you are used only after a Normal Probability Density, Student-t Probability Density, Ƶ2 Probability Density, or F Probability Density graph is drawn. k Normal Distribution • Normal Probability Density Normal Probability Density calculates the probability density (p) for x and then press w. • This... Executing an analysis function automatically stores the x and p values in list form. 5(DIST)1(NORM)1(Npd) • Normal probability density is applied to standard normal distribution. • Specifying Ʊ = 1 and ƫ = 0 specifies standard ...

Software User Guide
Page 245
...Inverse Normal Cumulative Distribution Inverse Normal Cumulative Distribution calculates the boundary value(s) of a normal cumulative distribution probability for specified values. 5(DIST)1(NORM)3(InvN) Area: probability value (0 < Area < 1) Inverse cumulative normal distribution calculates a value that represents the location...interval Tail:Right lower boundary of integration interval Tail:Central upper and lower boundaries of integration interval Specify the probability and use this formula to obtain the integration interval. • This calculator performs the above calculation using ...
...Inverse Normal Cumulative Distribution Inverse Normal Cumulative Distribution calculates the boundary value(s) of a normal cumulative distribution probability for specified values. 5(DIST)1(NORM)3(InvN) Area: probability value (0 < Area < 1) Inverse cumulative normal distribution calculates a value that represents the location...interval Tail:Right lower boundary of integration interval Tail:Central upper and lower boundaries of integration interval Specify the probability and use this formula to obtain the integration interval. • This calculator performs the above calculation using ...

Software User Guide
Page 246
... and a single x-value is entered as data. • Student-t Cumulative Distribution Student-t Cumulative Distribution calculates the Student-t cumulative probability of a Student-t distribution between a lower bound and an upper bound. 5(DIST)2(t)2(tcd) Calculation Result Output Examples When a list..., calculation results for a specified single x-value or a list. k Student-t Distribution • Student-t Probability Density Student-t Probability Density calculates the probability density (p) for each list element are displayed in list form. When a list is entered as data. 6-53
... and a single x-value is entered as data. • Student-t Cumulative Distribution Student-t Cumulative Distribution calculates the Student-t cumulative probability of a Student-t distribution between a lower bound and an upper bound. 5(DIST)2(t)2(tcd) Calculation Result Output Examples When a list..., calculation results for a specified single x-value or a list. k Student-t Distribution • Student-t Probability Density Student-t Probability Density calculates the probability density (p) for each list element are displayed in list form. When a list is entered as data. 6-53

Software User Guide
Page 247
k Ƶ2 Distribution • Ƶ2 Probability Density Ƶ2 Probability Density calculates the Ƶ2 probability density (p) for a specified single x-value or a list. When a list is specified, calculation results for each list element are displayed in list form. 5(DIST)3(CHI)1(Cpd) ...
k Ƶ2 Distribution • Ƶ2 Probability Density Ƶ2 Probability Density calculates the Ƶ2 probability density (p) for a specified single x-value or a list. When a list is specified, calculation results for each list element are displayed in list form. 5(DIST)3(CHI)1(Cpd) ...

Software User Guide
Page 248
• Ƶ2 Cumulative Distribution Ƶ2 Cumulative Distribution calculates the cumulative probability of a Ƶ2 distribution between a lower bound and an upper bound. 5(DIST)3(CHI)2(Ccd) Calculation Result Output Examples When a ... is entered as data. • Inverse Ƶ2 Cumulative Distribution Inverse Ƶ2 Cumulative Distribution calculates the lower bound value of a Ƶ2 cumulative distribution probability for a specified df (degrees of freedom) value. 5(DIST)3(CHI)3(InvC) Calculation Result Output Examples When a list is specified When variable (x) is specified ...
• Ƶ2 Cumulative Distribution Ƶ2 Cumulative Distribution calculates the cumulative probability of a Ƶ2 distribution between a lower bound and an upper bound. 5(DIST)3(CHI)2(Ccd) Calculation Result Output Examples When a ... is entered as data. • Inverse Ƶ2 Cumulative Distribution Inverse Ƶ2 Cumulative Distribution calculates the lower bound value of a Ƶ2 cumulative distribution probability for a specified df (degrees of freedom) value. 5(DIST)3(CHI)3(InvC) Calculation Result Output Examples When a list is specified When variable (x) is specified ...

Software User Guide
Page 249
k F Distribution • F Probability Density F Probability Density calculates the F probability density (p) for each list element are displayed in list form. When a list is entered as data. 6-56 Calculation Result Output Examples ...Graphing is supported only when a variable is specified and a single x-value is entered as data. • F Cumulative Distribution F Cumulative Distribution calculates the cumulative probability of an F distribution between a lower bound and an upper bound. 5(DIST)4(F)2(Fcd) Calculation Result Output Examples When a list is specified Graph when variable (x)...
k F Distribution • F Probability Density F Probability Density calculates the F probability density (p) for each list element are displayed in list form. When a list is entered as data. 6-56 Calculation Result Output Examples ...Graphing is supported only when a variable is specified and a single x-value is entered as data. • F Cumulative Distribution F Cumulative Distribution calculates the cumulative probability of an F distribution between a lower bound and an upper bound. 5(DIST)4(F)2(Fcd) Calculation Result Output Examples When a list is specified Graph when variable (x)...

Software User Guide
Page 250
... specified • There is no graphing for Inverse F Cumulative Distribution. k Binomial Distribution • Binomial Probability 5(DIST)5(BINOMIAL)1(Bpd) Binomial Probability calculates a probability at a specific single x-value or each list element for the discrete binomial distribution with the specified number ...trial. • Inverse F Cumulative Distribution Inverse F Cumulative Distribution calculates the lower bound value of an F cumulative distribution probability for specified n:df and d:df (degrees of freedom of success on each list element are displayed in list form. ...
... specified • There is no graphing for Inverse F Cumulative Distribution. k Binomial Distribution • Binomial Probability 5(DIST)5(BINOMIAL)1(Bpd) Binomial Probability calculates a probability at a specific single x-value or each list element for the discrete binomial distribution with the specified number ...trial. • Inverse F Cumulative Distribution Inverse F Cumulative Distribution calculates the lower bound value of an F cumulative distribution probability for specified n:df and d:df (degrees of freedom of success on each list element are displayed in list form. ...


