Software User Guide
Page 4
... Formatting 9-21 5. eActivity Function Menus 10-2 3. Using the Memory Manager 11-1 iii Before Performing Statistical Calculations 6-1 2. Input and Output Terms of Tests, Confidence Interval, and Distribution 6-65 9. Simple Interest ...7-3 3. Day/Date ... Keys 8-2 3. CASIO Scientific Function Calculator Special Commands ⇔ Text Conversion Table 8-59 9. Spreadsheet Mode Memory 9-34 Chapter 10 eActivity 1. Tests ...6-32 6. eActivity Overview...10-1 2. Chapter 6 Statistical Graphs and Calculations 1. Calculating and Graphing Single-Variable Statistical Data 6-8 3....
... Formatting 9-21 5. eActivity Function Menus 10-2 3. Using the Memory Manager 11-1 iii Before Performing Statistical Calculations 6-1 2. Input and Output Terms of Tests, Confidence Interval, and Distribution 6-65 9. Simple Interest ...7-3 3. Day/Date ... Keys 8-2 3. CASIO Scientific Function Calculator Special Commands ⇔ Text Conversion Table 8-59 9. Spreadsheet Mode Memory 9-34 Chapter 10 eActivity 1. Tests ...6-32 6. eActivity Overview...10-1 2. Chapter 6 Statistical Graphs and Calculations 1. Calculating and Graphing Single-Variable Statistical Data 6-8 3....
Software User Guide
Page 10
..., decimal, and hexadecimal values and matrices. Use this mode to perform single-variable (standard deviation) and paired-variable (regression) statistical calculations, to perform tests, to analyze data and to the variables in the Main Menu by changing the values assigned to draw... statistical graphs. Each file contains a 26-column × 999-line spreadsheet. Statistics Use this mode when you can also enter a mode without highlighting an icon in a function. 1-3 ...
..., decimal, and hexadecimal values and matrices. Use this mode to perform single-variable (standard deviation) and paired-variable (regression) statistical calculations, to perform tests, to analyze data and to the variables in the Main Menu by changing the values assigned to draw... statistical graphs. Each file contains a 26-column × 999-line spreadsheet. Statistics Use this mode when you can also enter a mode without highlighting an icon in a function. 1-3 ...
Software User Guide
Page 34
...} ... {list function menu} • {MAT} ... {matrix operation menu} • {COMPLEX} ... {complex number calculation menu} • {CALC} ... {functional analysis menu} • {STAT} ... {menu for paired-variable statistical estimated value, distribution, standard deviation, variance, and test functions} • {CONVERT} ... {metric conversion menu}* • {HYPERBL} ... {hyperbolic calculation menu} • {PROB} ... {probability/distribution calculation menu...
...} ... {list function menu} • {MAT} ... {matrix operation menu} • {COMPLEX} ... {complex number calculation menu} • {CALC} ... {functional analysis menu} • {STAT} ... {menu for paired-variable statistical estimated value, distribution, standard deviation, variance, and test functions} • {CONVERT} ... {metric conversion menu}* • {HYPERBL} ... {hyperbolic calculation menu} • {PROB} ... {probability/distribution calculation menu...
Software User Guide
Page 35
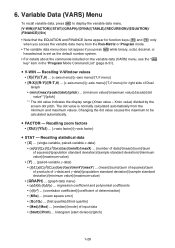
... appear for right side of x-data and y-data}/{population standard deviation}/{sample standard deviation}/{minimum value}/{maximum value} • {GRAPH} ... {graph data menu} • {a}/{b}/{c}/{d}/{e} ... Recalling statistical data • {X} ... {single-variable, paired-variable x-data} • {n}/{x¯ }/{Σx}/{Σx2}/{Ʊx}/{sx}/{minX}/{maxX} ... {number of data}/{mean}/{sum}/{sum of squares}/{population...
... appear for right side of x-data and y-data}/{population standard deviation}/{sample standard deviation}/{minimum value}/{maximum value} • {GRAPH} ... {graph data menu} • {a}/{b}/{c}/{d}/{e} ... Recalling statistical data • {X} ... {single-variable, paired-variable x-data} • {n}/{x¯ }/{Σx}/{Σx2}/{Ʊx}/{sx}/{minX}/{maxX} ... {number of data}/{mean}/{sum}/{sum of squares}/{population...
Software User Guide
Page 36
coordinates of summary points • {INPUT} ... {statistical calculation input values} • {n}/{x¯ }/{sx}/{n1}/{n2}/{x¯ 1}/{x¯ 2}/{sx1}/{sx2}/{sp} ... {size of sample}/{mean of sample}/ ...sample 1}/{size of sample 2}/{mean of sample 1}/ {mean of sample 2}/{standard deviation of sample 1}/{standard deviation of sample 2}/ {standard deviation of sample p} • {RESULT} ... {statistical calculation output values} • {TEST} ... {test calculation results} • {p}/{z}/{t}/{Chi}/{F}/{ pˆ }/{ pˆ 1}/{ pˆ 2}/{df}/{se}/{r}/{r 2}/{pa}/{Fa}/{Adf}/{SSa}/{MSa}/{...
coordinates of summary points • {INPUT} ... {statistical calculation input values} • {n}/{x¯ }/{sx}/{n1}/{n2}/{x¯ 1}/{x¯ 2}/{sx1}/{sx2}/{sp} ... {size of sample}/{mean of sample}/ ...sample 1}/{size of sample 2}/{mean of sample 1}/ {mean of sample 2}/{standard deviation of sample 1}/{standard deviation of sample 2}/ {standard deviation of sample p} • {RESULT} ... {statistical calculation output values} • {TEST} ... {test calculation results} • {p}/{z}/{t}/{Chi}/{F}/{ pˆ }/{ pˆ 1}/{ pˆ 2}/{df}/{se}/{r}/{r 2}/{pa}/{Fa}/{Adf}/{SSa}/{MSa}/{...
Software User Guide
Page 40
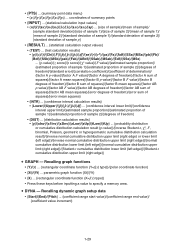
u Func Type (graph function type) Pressing one of the following function keys also switches the function of the v key. • {Y=}/{r=}/{Parm}/{X=} ... {rectangular coordinate (Y= f (x) type)}/{polar coordinate}/ {parametric}/{rectangular coordinate (X= f (y) type)} graph • {Y>}/{Yf(x)}/{y}/{Xf(y)}/{x
u Func Type (graph function type) Pressing one of the following function keys also switches the function of the v key. • {Y=}/{r=}/{Parm}/{X=} ... {rectangular coordinate (Y= f (x) type)}/{polar coordinate}/ {parametric}/{rectangular coordinate (X= f (y) type)} graph • {Y>}/{Yf(x)}/{y}/{Xf(y)}/{x

Software User Guide
Page 45
k Image File Compatibility An image file (g3p/g3b) saved (or updated) on the fx-CG20 will not be compatible with the fx-CG10. • "To capture a screen image" (page 1-36) • "To update the background image V-Window settings with current V-Window settings" (page 5-11) • "Adjusting the Lightness (..." (page 15-5) • "K1(PICTURE)" under "Graph Screen Key Operations" (page ε-39) • Other image files saved from the graph screen of any mode (Statistics, Spreadsheet, Financial, etc.) 1-38 For details, see "Reset" (page 12-4).
k Image File Compatibility An image file (g3p/g3b) saved (or updated) on the fx-CG20 will not be compatible with the fx-CG10. • "To capture a screen image" (page 1-36) • "To update the background image V-Window settings with current V-Window settings" (page 5-11) • "Adjusting the Lightness (..." (page 15-5) • "K1(PICTURE)" under "Graph Screen Key Operations" (page ε-39) • Other image files saved from the graph screen of any mode (Statistics, Spreadsheet, Financial, etc.) 1-38 For details, see "Reset" (page 12-4).
Software User Guide
Page 108
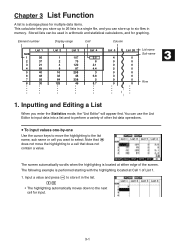
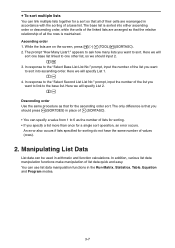
... does not contain a value. Inputting and Editing a List When you can store up to 26 lists in a single file, and you enter the Statistics mode, the "List Editor" will appear first. u To input values one-by-one Use the cursor keys to move the highlighting to select. Chapter... 3 List Function A list is located at Cell 1 of other list data operations. You can be used in arithmetic and statistical calculations, and for graphing. Input a value and press w to six files in the list. The screen automatically scrolls when the highlighting is a storage...
... does not contain a value. Inputting and Editing a List When you can store up to 26 lists in a single file, and you enter the Statistics mode, the "List Editor" will appear first. u To input values one-by-one Use the cursor keys to move the highlighting to select. Chapter... 3 List Function A list is located at Cell 1 of other list data operations. You can be used in arithmetic and statistical calculations, and for graphing. Input a value and press w to six files in the list. The screen automatically scrolls when the highlighting is a storage...
Software User Guide
Page 114
... the number of the list you specify a list more than once for the ascending order sort. Here we should press 2(SORTDES) in the Run-Matrix, Statistics, Table, Equation and Program modes. 3-7 In response to sort into either ascending order or descending order, while the cells of the linked lists are arranged...
... the number of the list you specify a list more than once for the ascending order sort. Here we should press 2(SORTDES) in the Run-Matrix, Statistics, Table, Equation and Program modes. 3-7 In response to sort into either ascending order or descending order, while the cells of the linked lists are arranged...
Software User Guide
Page 116
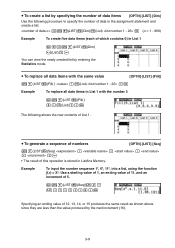
... value of 12, 13, 14, or 15 produces the same result as shown above since they are less than the value produced by entering the Statistics mode. Example To input the number sequence 12, 62, 112, into a list, using the function f(x) = X2. u To replace all data items with the same value...
... value of 12, 13, 14, or 15 produces the same result as shown above since they are less than the value produced by entering the Statistics mode. Example To input the number sequence 12, 62, 112, into a list, using the function f(x) = X2. u To replace all data items with the same value...

Software User Guide
Page 123
... move the highlighting to List 1 in the Table mode to input values that Table mode column Y1 has been copied to List 1. 3-16 Enter the Statistics mode to confirm that result from the table to the list. Create the number table. 3. To do this, first generate a table and then use the... with graphing functions. There are certain limitations on using the graphing functions of this calculator, you can use the numeric table generation functions in the Statistics mode 1.
... move the highlighting to List 1 in the Table mode to input values that Table mode column Y1 has been copied to List 1. 3-16 Enter the Statistics mode to confirm that result from the table to the list. Create the number table. 3. To do this, first generate a table and then use the... with graphing functions. There are certain limitations on using the graphing functions of this calculator, you can use the numeric table generation functions in the Statistics mode 1.
Software User Guide
Page 124
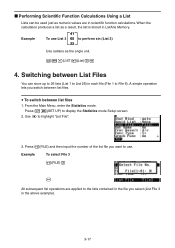
...file you want to use List 3 65 to perform sin (List 3) 22 Use radians as the angle unit. Use c to display the Statistics mode Setup screen. 2. Press 1(FILE) and then input the number of the list file you select (List File 3 in scientific function calculations.... From the Main Menu, enter the Statistics mode. A simple operation lets you switch between list files 1. u To switch between list files. sK1(LIST)1(List)dw 4. Example To select File 3 ...
...file you want to use List 3 65 to perform sin (List 3) 22 Use radians as the angle unit. Use c to display the Statistics mode Setup screen. 2. Press 1(FILE) and then input the number of the list file you select (List File 3 in scientific function calculations.... From the Main Menu, enter the Statistics mode. A simple operation lets you switch between list files 1. u To switch between list files. sK1(LIST)1(List)dw 4. Example To select File 3 ...

Software User Guide
Page 160
... the graph screen. The first graph is drawn using five different colors in the following V-Window settings. Xmin = -5, Xmax = 5, Xscale = 1 Ymin = -10, Ymax = 10, Yscale = 2 1 m Statistics dwbw-bw 2 m Graph 3 !m(SET UP)cccc3(Off)J 4 !3(V-WIN)-fwfwbwc-ba wbawcwJ 5 3(TYPE)1(Y=)!b(List)bvx-dw 6 6(DRAW) • When multiple graphs are two types of functions...
... the graph screen. The first graph is drawn using five different colors in the following V-Window settings. Xmin = -5, Xmax = 5, Xscale = 1 Ymin = -10, Ymax = 10, Yscale = 2 1 m Statistics dwbw-bw 2 m Graph 3 !m(SET UP)cccc3(Off)J 4 !3(V-WIN)-fwfwbwc-ba wbawcwJ 5 3(TYPE)1(Y=)!b(List)bvx-dw 6 6(DRAW) • When multiple graphs are two types of functions...
Software User Guide
Page 194
... when you have input using the List Editor, see "Chapter 3 List Function". k Statistical Graph Parameters You can change to one of a number of this manual. 1. Chapter 6 Statistical Graphs and Calculations Important! In each of the graph being drawn. You can specify the...8226; {GRAPH1}/{GRAPH2}/{GRAPH3} ... Note that when you can also use a variety of graph screen shots. Before Performing Statistical Calculations Entering the Statistics mode from those shown in the graph menu (GRAPH1, GRAPH2, GRAPH3). This chapter contains a number of different regression calculations...
... when you have input using the List Editor, see "Chapter 3 List Function". k Statistical Graph Parameters You can change to one of a number of this manual. 1. Chapter 6 Statistical Graphs and Calculations Important! In each of the graph being drawn. You can specify the...8226; {GRAPH1}/{GRAPH2}/{GRAPH3} ... Note that when you can also use a variety of graph screen shots. Before Performing Statistical Calculations Entering the Statistics mode from those shown in the graph menu (GRAPH1, GRAPH2, GRAPH3). This chapter contains a number of different regression calculations...
Software User Guide
Page 195
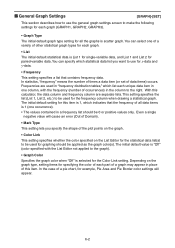
... setting for all data items is 1 (one column, with the List Editor not applied to be used for the frequency column when drawing a statistical graph. The initial default value is "Off" (color specified with the frequency (number of occurrences) in place of this item is 1, which.... Even a single negative value will appear. 6-2 In the case of a pie chart, for this item. You can select one of a variety of other statistical graph types for each unique data item in one occurrence). • The values contained in a frequency list should be applied as the graph color(s). Depending...
... setting for all data items is 1 (one column, with the List Editor not applied to be used for the frequency column when drawing a statistical graph. The initial default value is "Off" (color specified with the frequency (number of occurrences) in place of this item is 1, which.... Even a single negative value will appear. 6-2 In the case of a pie chart, for this item. You can select one of a variety of other statistical graph types for each unique data item in one occurrence). • The values contained in a frequency list should be applied as the graph color(s). Depending...
Software User Guide
Page 196
... YList data is reflected in the graph. u To display the general graph settings screen Pressing 1(GRAPH)6(SET) displays the general graph settings screen. • StatGraph (statistical graph specification) • {GRAPH1}/{GRAPH2}/{GRAPH3} ...
... YList data is reflected in the graph. u To display the general graph settings screen Pressing 1(GRAPH)6(SET) displays the general graph settings screen. • StatGraph (statistical graph specification) • {GRAPH1}/{GRAPH2}/{GRAPH3} ...
Software User Guide
Page 200
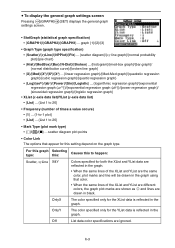
Use the cursor keys to move the highlighting to "Manual". k Statistical Graph V-Window Settings V-Window parameters are set automatically for the following types of graphs regardless of whether or not the Stat Wind item is set .... • D1 Border, D2 Border, D3 Border (Specifies the border colors of bar graphs Data 1, Data 2, and Data 3.) Settings are the same as those for statistical graphing. To return to previous menu.) Note that the StatGraph1 setting is for Graph 1 (GRAPH1 of the graph menu), StatGraph2 is for Graph 3. 2. Pie, 1-Sample...
Use the cursor keys to move the highlighting to "Manual". k Statistical Graph V-Window Settings V-Window parameters are set automatically for the following types of graphs regardless of whether or not the Stat Wind item is set .... • D1 Border, D2 Border, D3 Border (Specifies the border colors of bar graphs Data 1, Data 2, and Data 3.) Settings are the same as those for statistical graphing. To return to previous menu.) Note that the StatGraph1 setting is for Graph 1 (GRAPH1 of the graph menu), StatGraph2 is for Graph 3. 2. Pie, 1-Sample...
Software User Guide
Page 201
... members of the alphabetic label letters. 6-8 The maximum number of the list used to select from among the marks you are available for single-variable statistics. Press A, J or !J(QUIT) to return to plot. When "%" is labeled A, B, C, and so on, corresponding to lines 1, 2, 3, and so ...on page 6-1 to make the settings you want to the List Editor. Single-variable statistics include distribution and sum. XList specifies the list where data is input, and Mark Type is used for example, there is data with a normal distribution...
... members of the alphabetic label letters. 6-8 The maximum number of the list used to select from among the marks you are available for single-variable statistics. Press A, J or !J(QUIT) to return to plot. When "%" is labeled A, B, C, and so on, corresponding to lines 1, 2, 3, and so ...on page 6-1 to make the settings you want to the List Editor. Single-variable statistics include distribution and sum. XList specifies the list where data is input, and Mark Type is used for example, there is data with a normal distribution...
Software User Guide
Page 204
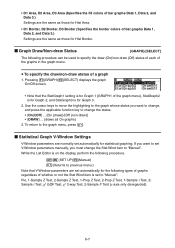
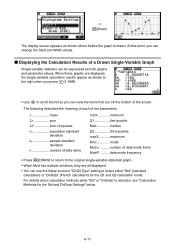
The following describes the meaning of each of the screen. k Displaying the Calculation Results of a Drawn Single-Variable Graph Single-variable statistics can change the Start and Width values. For details about calculation methods while "Std" or "OnData" is drawn. At this ...Mod mode Mod:n ..........number of data mode items Mod:F ..........data mode frequency • Press 6(DRAW) to return to the original single-variable statistical graph. • When Mod has multiple solutions, they are displayed, the single-variable calculation results appear as shown above before the graph is ...
The following describes the meaning of each of the screen. k Displaying the Calculation Results of a Drawn Single-Variable Graph Single-variable statistics can change the Start and Width values. For details about calculation methods while "Std" or "OnData" is drawn. At this ...Mod mode Mod:n ..........number of data mode items Mod:F ..........data mode frequency • Press 6(DRAW) to return to the original single-variable statistical graph. • When Mod has multiple solutions, they are displayed, the single-variable calculation results appear as shown above before the graph is ...
Software User Guide
Page 207
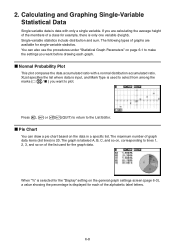
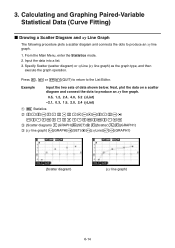
...the List Editor. Press A, J or !J(QUIT) to return to produce an xy line graph. 0.5, 1.2, 2.4, 4.0, 5.2 (xList) -2.1, 0.3, 1.5, 2.0, 2.4 (yList) 1 m Statistics 2 a.fwb.cwc.ewewf.cwe -c.bwa.dwb.fwcwc.ew 3 (Scatter diagram) 1(GRAPH)6(SET)c1(Scatter)J1(GRAPH1) 3 (xy line graph) 1(GRAPH)6(SET)c2(xyLine)J1(GRAPH1...) (Scatter diagram) (xy line graph) 6-14 Calculating and Graphing Paired-Variable Statistical Data (Curve Fitting) k Drawing a Scatter Diagram and xy Line Graph The following procedure plots a scatter diagram and connects the dots to...
...the List Editor. Press A, J or !J(QUIT) to return to produce an xy line graph. 0.5, 1.2, 2.4, 4.0, 5.2 (xList) -2.1, 0.3, 1.5, 2.0, 2.4 (yList) 1 m Statistics 2 a.fwb.cwc.ewewf.cwe -c.bwa.dwb.fwcwc.ew 3 (Scatter diagram) 1(GRAPH)6(SET)c1(Scatter)J1(GRAPH1) 3 (xy line graph) 1(GRAPH)6(SET)c2(xyLine)J1(GRAPH1...) (Scatter diagram) (xy line graph) 6-14 Calculating and Graphing Paired-Variable Statistical Data (Curve Fitting) k Drawing a Scatter Diagram and xy Line Graph The following procedure plots a scatter diagram and connects the dots to...


