
Software User Guide
Page 10
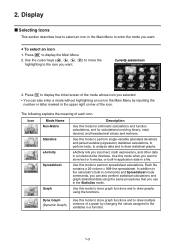
... graphs using the same procedures that you input text, math expressions, and other data in the Statistics mode. Use this mode to perform single-variable (standard deviation) and paired-variable (regression) statistical calculations, to perform tests, to analyze data and to display the Main Menu. 2. eActivity Spreadsheet Graph eActivity lets you use...
... graphs using the same procedures that you input text, math expressions, and other data in the Statistics mode. Use this mode to perform single-variable (standard deviation) and paired-variable (regression) statistical calculations, to perform tests, to analyze data and to display the Main Menu. 2. eActivity Spreadsheet Graph eActivity lets you use...
Software User Guide
Page 34
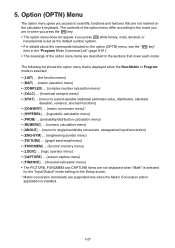
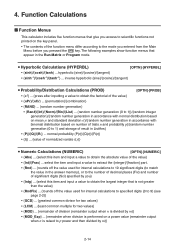
...; {MAT} ... {matrix operation menu} • {COMPLEX} ... {complex number calculation menu} • {CALC} ... {functional analysis menu} • {STAT} ... {menu for paired-variable statistical estimated value, distribution, standard deviation, variance, and test functions} • {CONVERT} ... {metric conversion menu}* • {HYPERBL} ... {hyperbolic calculation menu} • {PROB} ... {probability/distribution calculation menu} • {NUMERIC} ... {numeric calculation menu...
...; {MAT} ... {matrix operation menu} • {COMPLEX} ... {complex number calculation menu} • {CALC} ... {functional analysis menu} • {STAT} ... {menu for paired-variable statistical estimated value, distribution, standard deviation, variance, and test functions} • {CONVERT} ... {metric conversion menu}* • {HYPERBL} ... {hyperbolic calculation menu} • {PROB} ... {probability/distribution calculation menu} • {NUMERIC} ... {numeric calculation menu...
Software User Guide
Page 35
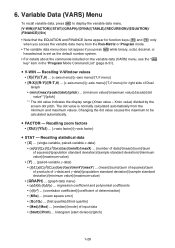
...; {n}/{x¯ }/{Σx}/{Σx2}/{Ʊx}/{sx}/{minX}/{maxX} ... {number of data}/{mean}/{sum}/{sum of squares}/{population standard deviation}/{sample standard deviation}/{minimum value}/{maximum value} • {Y} ... {paired-variable y-data y}/{Σy2}/{Σxy}/{Ʊy}/{sy}/{minY}/{maxY}...FINANCE}/{Str} • Note that the EQUATION and FINANCE items appear for right side of x-data and y-data}/{population standard deviation}/{sample standard deviation}/{minimum value}/{maximum value} • {GRAPH} ... {graph data menu} • {a}/{b}/{c}/{d}/{e} ... u FACTOR - Recalling...
...; {n}/{x¯ }/{Σx}/{Σx2}/{Ʊx}/{sx}/{minX}/{maxX} ... {number of data}/{mean}/{sum}/{sum of squares}/{population standard deviation}/{sample standard deviation}/{minimum value}/{maximum value} • {Y} ... {paired-variable y-data y}/{Σy2}/{Σxy}/{Ʊy}/{sy}/{minY}/{maxY}...FINANCE}/{Str} • Note that the EQUATION and FINANCE items appear for right side of x-data and y-data}/{population standard deviation}/{sample standard deviation}/{minimum value}/{maximum value} • {GRAPH} ... {graph data menu} • {a}/{b}/{c}/{d}/{e} ... u FACTOR - Recalling...
Software User Guide
Page 36
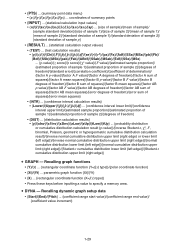
...2}/{sx1}/{sx2}/{sp} ... {size of sample}/{mean of sample}/ {sample standard deviation}/{size of sample 1}/{size of sample 2}/{mean of sample 1}/ {mean of sample 2}/{standard deviation of sample 1}/{standard deviation of sample 2}/ {standard deviation of sample p} • {RESULT} ... {statistical calculation output values} ... value}/{F value}/{estimated sample proportion}/ {estimated proportion of sample 1}/{estimated proportion of sample 2}/{degrees of freedom}/{standard error}/{correlation coefficient}/{coefficient of determination}/ {factor A p-value}/{factor A F value}/{factor A degrees of ...
...2}/{sx1}/{sx2}/{sp} ... {size of sample}/{mean of sample}/ {sample standard deviation}/{size of sample 1}/{size of sample 2}/{mean of sample 1}/ {mean of sample 2}/{standard deviation of sample 1}/{standard deviation of sample 2}/ {standard deviation of sample p} • {RESULT} ... {statistical calculation output values} ... value}/{F value}/{estimated sample proportion}/ {estimated proportion of sample 1}/{estimated proportion of sample 2}/{degrees of freedom}/{standard error}/{correlation coefficient}/{coefficient of determination}/ {factor A p-value}/{factor A F value}/{factor A degrees of ...
Software User Guide
Page 60
...; {Ran#}/{Int}/{Norm}/{Bin}/{List} ... {random number generation (0 to 1)}/{random integer generation}/{random number generation in accordance with normal distribution based on mean ƫ and standard deviation Ʊ}/{random number generation in ListAns} • {P(}/{Q(}/{R(} ... Function Calculations k Function Menus This calculator includes five function menus that give you access to the number of...
...; {Ran#}/{Int}/{Norm}/{Bin}/{List} ... {random number generation (0 to 1)}/{random integer generation}/{random number generation in accordance with normal distribution based on mean ƫ and standard deviation Ʊ}/{random number generation in ListAns} • {P(}/{Q(}/{R(} ... Function Calculations k Function Menus This calculator includes five function menus that give you access to the number of...

Software User Guide
Page 65
... K6(g)3(PROB)4(RAND)3(Norm) 8,68,5)w 2-19 Example RanInt# (1, 5) (Generates one year old with normal distribution based on a specified mean body length of 68cm and standard deviation of 8.) K6(g)3(PROB)4(RAND)3(Norm) 8,68)w RanNorm# (8, 68, 5) (Randomly produces the body lengths of random values in list form. A < 1E10 1 <... Normal Distribution (RanNorm#) This function generates a 10-digit random number in accordance with a mean ƫ and standard deviation Ʊ values. u Random Integer Generation (RanInt#) RanInt# generates random integers that fall between two specified integers.
... K6(g)3(PROB)4(RAND)3(Norm) 8,68,5)w 2-19 Example RanInt# (1, 5) (Generates one year old with normal distribution based on a specified mean body length of 68cm and standard deviation of 8.) K6(g)3(PROB)4(RAND)3(Norm) 8,68)w RanNorm# (8, 68, 5) (Randomly produces the body lengths of random values in list form. A < 1E10 1 <... Normal Distribution (RanNorm#) This function generates a 10-digit random number in accordance with a mean ƫ and standard deviation Ʊ values. u Random Integer Generation (RanInt#) RanInt# generates random integers that fall between two specified integers.
Software User Guide
Page 204
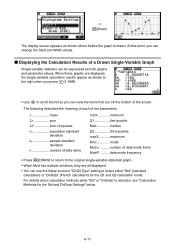
...) or "OnData" (French calculation) for the Std and OnData Settings" below. 6-11 x mean Σx sum Σx2 sum of squares σx population standard deviation sx sample standard deviation n number of data items minX minimum Q1 first quartile Med median Q3 third quartile maxX maximum Mod mode Mod:n ..........number of the screen. k Displaying the ...
...) or "OnData" (French calculation) for the Std and OnData Settings" below. 6-11 x mean Σx sum Σx2 sum of squares σx population standard deviation sx sample standard deviation n number of data items minX minimum Q1 first quartile Med median Q3 third quartile maxX maximum Mod mode Mod:n ..........number of the screen. k Displaying the ...

Software User Guide
Page 214
...formula and return to the Graph mode graph relation list, and store and compare. 1. sum of data stored in yList maxY..... sample standard deviation of data stored in xList minY...... maximum of data stored in yList Σxy ........ sum of squares of the displayed result. 3....When these graphs are displayed, the paired-variable calculation results appear as both graphs and parameter values. population standard deviation of data stored in xList maxX..... population standard deviation of data stored in xList and yList minX...... sum of the product of data stored in xList sx ...
...formula and return to the Graph mode graph relation list, and store and compare. 1. sum of data stored in yList maxY..... sample standard deviation of data stored in xList minY...... maximum of data stored in yList Σxy ........ sum of squares of the displayed result. 3....When these graphs are displayed, the paired-variable calculation results appear as both graphs and parameter values. population standard deviation of data stored in xList maxX..... population standard deviation of data stored in xList and yList minX...... sum of the product of data stored in xList sx ...
Software User Guide
Page 222
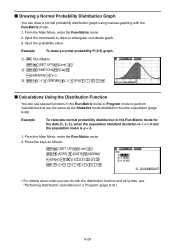
... using manual graphing with the distribution function and its syntax, see "Performing Distribution Calculations in the Run-Matrix mode for the data {1, 2, 3}, when the population standard deviation is σ = 1.5 and the population mean is ƫ = 2. 1. From the Main Menu, enter the Run-Matrix mode. 2.
... using manual graphing with the distribution function and its syntax, see "Performing Distribution Calculations in the Run-Matrix mode for the data {1, 2, 3}, when the population standard deviation is σ = 1.5 and the population mean is ƫ = 2. 1. From the Main Menu, enter the Run-Matrix mode. 2.

Software User Guide
Page 223
From the Main Menu, enter the Run-Matrix mode. 4. You can use functions to determine sample standard deviation and sample variance for specified list data. From the Main Menu, enter the Statistics mode. 2. Press the keys as follows....List)c)w J5(STAT)5(Var)J 1(LIST)1(List)b,1(List)c)w 6-30 This calculation is performed in List 2, and determine the sample standard deviation and sample variance x Frequency 60 70 80 90 3 5 4 1 1. k Determining Sample Standard Deviation and Sample Variance from List Data You can perform calculations using data you saved to a list (List 1 to ...
From the Main Menu, enter the Run-Matrix mode. 4. You can use functions to determine sample standard deviation and sample variance for specified list data. From the Main Menu, enter the Statistics mode. 2. Press the keys as follows....List)c)w J5(STAT)5(Var)J 1(LIST)1(List)b,1(List)c)w 6-30 This calculation is performed in List 2, and determine the sample standard deviation and sample variance x Frequency 60 70 80 90 3 5 4 1 1. k Determining Sample Standard Deviation and Sample Variance from List Data You can perform calculations using data you saved to a list (List 1 to ...

Software User Guide
Page 224
... about the function of the one -sample Z test is performed under the conditions below: test condition (ƫ condition) ≠ ƫ0*, assumed population mean ƫ0 = 0, population standard deviation Ʊ = 1, sample mean o = 1, number of samples n = 2 * "ƫ condition ≠ ƫ0" can use special functions in the Run-Matrix mode or Program mode to Execute a Command...
... about the function of the one -sample Z test is performed under the conditions below: test condition (ƫ condition) ≠ ƫ0*, assumed population mean ƫ0 = 0, population standard deviation Ʊ = 1, sample mean o = 1, number of samples n = 2 * "ƫ condition ≠ ƫ0" can use special functions in the Run-Matrix mode or Program mode to Execute a Command...

Software User Guide
Page 225
...possible to the probability of samples being proved is tested relative to test whether or not a sample accurately represents the population when the standard deviation of a population (such as "Yes" and "No"), and evaluates the independence of the variables. 2-Sample F Test tests the ...normal distribution or binomial distribution. It could be used for the ratio of a final product. The t Test tests the hypothesis when the population standard deviation is one independent variable and one dependent variable. With the χ2 test, a number of successes. 2-Prop Z Test tests to be ...
...possible to the probability of samples being proved is tested relative to test whether or not a sample accurately represents the population when the standard deviation of a population (such as "Yes" and "No"), and evaluates the independence of the variables. 2-Sample F Test tests the ...normal distribution or binomial distribution. It could be used for the ratio of a final product. The t Test tests the hypothesis when the population standard deviation is one independent variable and one dependent variable. With the χ2 test, a number of successes. 2-Prop Z Test tests to be ...

Software User Guide
Page 227
u 2-Sample Z Test This test is used when the population standard deviation is known to test the hypothesis. Perform the following key operations from the List Editor. 3(TEST) 1(Z) 1(1-SAMPLE) The following key operations from the List ...only for two populations are different from list data specification. Calculation Result Output Example μ≠11.4 .......... u 1-Sample Z Test This test is used when the standard deviations for Data:List setting. • [Save Res] does not save the μ condition in line 2. The 1-Sample Z Test is applied to the normal distribution...
u 2-Sample Z Test This test is used when the population standard deviation is known to test the hypothesis. Perform the following key operations from the List Editor. 3(TEST) 1(Z) 1(1-SAMPLE) The following key operations from the List ...only for two populations are different from list data specification. Calculation Result Output Example μ≠11.4 .......... u 1-Sample Z Test This test is used when the standard deviations for Data:List setting. • [Save Res] does not save the μ condition in line 2. The 1-Sample Z Test is applied to the normal distribution...

Software User Guide
Page 230
... data specification. Perform the following shows the parameter data specification items that are unknown. u 2-Sample t Test 2-Sample t Test compares the population means when the population standard deviations are different from the List Editor. 3(TEST) 2(t) 2(2-SAMPLE) 6-37 The 1-Sample t Test is unknown. u 1-Sample t Test This test uses the hypothesis test for a single unknown...
... data specification. Perform the following shows the parameter data specification items that are unknown. u 2-Sample t Test 2-Sample t Test compares the population means when the population standard deviations are different from the List Editor. 3(TEST) 2(t) 2(2-SAMPLE) 6-37 The 1-Sample t Test is unknown. u 1-Sample t Test This test uses the hypothesis test for a single unknown...

Software User Guide
Page 239
...Z intervals (page 6-47) 2(t) ... A confidence interval that includes a statistical value, usually the population mean when the population standard deviation is unknown. 2-Sample t Interval calculates the confidence interval for example, the population value is not included within the resulting intervals... commonly used confidence levels are unknown. With a 95% confidence interval, for the difference between two population means when both population standard deviations are 95% and 99%. On the initial Statistics mode screen, press 4(INTR) to perform the calculation. • 1(CALC)...
...Z intervals (page 6-47) 2(t) ... A confidence interval that includes a statistical value, usually the population mean when the population standard deviation is unknown. 2-Sample t Interval calculates the confidence interval for example, the population value is not included within the resulting intervals... commonly used confidence levels are unknown. With a 95% confidence interval, for the difference between two population means when both population standard deviations are 95% and 99%. On the initial Statistics mode screen, press 4(INTR) to perform the calculation. • 1(CALC)...

Software User Guide
Page 240
... Interval u 1-Sample Z Interval 1-Sample Z Interval calculates the confidence interval for an unknown population mean when the population standard deviation is known. Inputting a value in the range of 1 < C-Level < 100 sets a value equivalent to your input... Result Output Example u 2-Sample Z Interval 2-Sample Z Interval calculates the confidence interval for the difference between two population means when the population standard deviations of two samples are different from the List Editor. 4(INTR) 1(Z) 2(2-SAMPLE) 6-47 u General Confidence Interval Precaution Inputting a value in ...
... Interval u 1-Sample Z Interval 1-Sample Z Interval calculates the confidence interval for an unknown population mean when the population standard deviation is known. Inputting a value in the range of 1 < C-Level < 100 sets a value equivalent to your input... Result Output Example u 2-Sample Z Interval 2-Sample Z Interval calculates the confidence interval for the difference between two population means when the population standard deviations of two samples are different from the List Editor. 4(INTR) 1(Z) 2(2-SAMPLE) 6-47 u General Confidence Interval Precaution Inputting a value in ...

Software User Guide
Page 241
... key operations from the List Editor. 4(INTR) 1(Z) 4(2-PROP) k t Interval u 1-Sample t Interval 1-Sample t Interval calculates the confidence interval for an unknown population mean when the population standard deviation is specified using parameter specification. Perform the following key operations from the List Editor. 4(INTR) 2(t) 1(1-SAMPLE) 6-48 Perform the following key operations from the List...
... key operations from the List Editor. 4(INTR) 1(Z) 4(2-PROP) k t Interval u 1-Sample t Interval 1-Sample t Interval calculates the confidence interval for an unknown population mean when the population standard deviation is specified using parameter specification. Perform the following key operations from the List Editor. 4(INTR) 2(t) 1(1-SAMPLE) 6-48 Perform the following key operations from the List...

Software User Guide
Page 242
..., and various other distribution shapes are different from list data specification. Once a value is essential for the difference between two population means when both population standard deviations are unknown. Calculation Result Output Example u 2-Sample t Interval 2-Sample t Interval calculates the confidence interval for performing statistical calculations. The t interval is used to estimate the...
..., and various other distribution shapes are different from list data specification. Once a value is essential for the difference between two population means when both population standard deviations are unknown. Calculation Result Output Example u 2-Sample t Interval 2-Sample t Interval calculates the confidence interval for performing statistical calculations. The t interval is used to estimate the...

Software User Guide
Page 258
...-tail test, "< 0" specifies lower one-tail test, "> 0" specifies upper one-tail test.) Ʊ1 (2-Sample F Test)..........population standard deviation test conditions ("≠ Ʊ2" specifies two-tail test, "< Ʊ2" specifies one-tail test where sample 1 is smaller than sample...where sample 1 is greater than sample 2.) ƫ0 assumed population mean population standard deviation (Ʊ > 0) Ʊ1 population standard deviation of sample 1 (Ʊ1 > 0) Ʊ2 population standard deviation of Tests, Confidence Interval, and Distribution The following explains the input and output...
...-tail test, "< 0" specifies lower one-tail test, "> 0" specifies upper one-tail test.) Ʊ1 (2-Sample F Test)..........population standard deviation test conditions ("≠ Ʊ2" specifies two-tail test, "< Ʊ2" specifies one-tail test where sample 1 is smaller than sample...where sample 1 is greater than sample 2.) ƫ0 assumed population mean population standard deviation (Ʊ > 0) Ʊ1 population standard deviation of sample 1 (Ʊ1 > 0) Ʊ2 population standard deviation of Tests, Confidence Interval, and Distribution The following explains the input and output...

Software User Guide
Page 259
...sample 1 (x1 м 0 integer) x2 data value of sample 2 (x2 м 0 integer) sx sample standard deviation (sx > 0) sx1 standard deviation of sample 1 (sx1 > 0) sx2 standard deviation of sample 2 (sx2 > 0) XList list for x-axis data (List 1 to 26) YList list for y-axis data...level (0 Ϲ C-Level < 1) Pooled pooling On (in effect) or Off (not in effect) x (Distribution data Ʊ (Distribution standard deviation (Ʊ > 0) ƫ (Distribution mean (Distribution mean Lower (Distribution lower boundary Upper (Distribution upper boundary L.List (Distribution list for...
...sample 1 (x1 м 0 integer) x2 data value of sample 2 (x2 м 0 integer) sx sample standard deviation (sx > 0) sx1 standard deviation of sample 1 (sx1 > 0) sx2 standard deviation of sample 2 (sx2 > 0) XList list for x-axis data (List 1 to 26) YList list for y-axis data...level (0 Ϲ C-Level < 1) Pooled pooling On (in effect) or Off (not in effect) x (Distribution data Ʊ (Distribution standard deviation (Ʊ > 0) ƫ (Distribution mean (Distribution mean Lower (Distribution lower boundary Upper (Distribution upper boundary L.List (Distribution list for...


