Software User Guide
Page 196
... distribution curve}/{broken line graph} • {X}/{Med}/{X2}/{X3}/{X4} ... {linear regression graph}/{Med-Med graph}/{quadratic regression graph}/{cubic regression graph}/{quartic regression graph} • {Log}/{aebx}/{abx}/{Power}/{Sin}/{Logistic} ... {logarithmic regression graph}/{exponential regression graph (aebx)}/{exponential regression graph (abx)}/{power regression graph}/ {sinusoidal regression graph}/{logistic regression graph} • XList (x-axis data list)/YList (y-axis data list...
... distribution curve}/{broken line graph} • {X}/{Med}/{X2}/{X3}/{X4} ... {linear regression graph}/{Med-Med graph}/{quadratic regression graph}/{cubic regression graph}/{quartic regression graph} • {Log}/{aebx}/{abx}/{Power}/{Sin}/{Logistic} ... {logarithmic regression graph}/{exponential regression graph (aebx)}/{exponential regression graph (abx)}/{power regression graph}/ {sinusoidal regression graph}/{logistic regression graph} • XList (x-axis data list)/YList (y-axis data list...

Software User Guide
Page 208
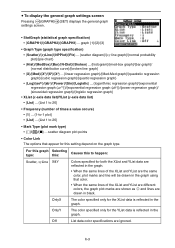
...}/{Log}/{aebx}/{abx}/{Power}/{Sin}/{Logistic} ... {linear regression (ax+b form)}/{linear regression (a+bx form)}/{Med-Med}/{quadratic regression}/{cubic regression}/{quartic regression}/{logarithmic regression}/{exponential regression (aebx form)}/{exponential regression (abx form)}/{power regression}/ {sinusoidal regression}/{logistic regression} calculation and graphing • {2-VAR}... {paired-variable statistical results} 6-15 k Drawing a Regression Graph Use the following procedure to display the regression parameters, and then draw the corresponding...
...}/{Log}/{aebx}/{abx}/{Power}/{Sin}/{Logistic} ... {linear regression (ax+b form)}/{linear regression (a+bx form)}/{Med-Med}/{quadratic regression}/{cubic regression}/{quartic regression}/{logarithmic regression}/{exponential regression (aebx form)}/{exponential regression (abx form)}/{power regression}/ {sinusoidal regression}/{logistic regression} calculation and graphing • {2-VAR}... {paired-variable statistical results} 6-15 k Drawing a Regression Graph Use the following procedure to display the regression parameters, and then draw the corresponding...
Software User Guide
Page 209
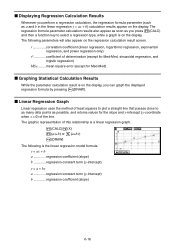
... following is on the display, you can graph the displayed regression formula by pressing 6(DRAW). r correlation coefficient (linear regression, logarithmic regression, exponential regression, and power regression only) r2 coefficient of the line. y = ax + b a regression coefficient (slope) b regression constant term (y-intercept) y = a + bx a regression constant term (y-intercept) b regression coefficient (slope) 6-16 k Linear Regression Graph Linear regression uses the method of least squares to plot a straight line...
... following is on the display, you can graph the displayed regression formula by pressing 6(DRAW). r correlation coefficient (linear regression, logarithmic regression, exponential regression, and power regression only) r2 coefficient of the line. y = ax + b a regression coefficient (slope) b regression constant term (y-intercept) y = a + bx a regression constant term (y-intercept) b regression coefficient (slope) 6-16 k Linear Regression Graph Linear regression uses the method of least squares to plot a straight line...

Software User Guide
Page 210
... coefficient c .......... It uses the method of least squares to draw a curve that passes close to linear regression, but it is suspected that represents this is quadratic/cubic/quartic regression. regression first coefficient d.......... regression constant term (y-intercept) Quartic regression Model formula....... regression second coefficient d.......... This is similar to as many data points as possible. k Med-Med Graph When...
... coefficient c .......... It uses the method of least squares to draw a curve that passes close to linear regression, but it is suspected that represents this is quadratic/cubic/quartic regression. regression first coefficient d.......... regression constant term (y-intercept) Quartic regression Model formula....... regression second coefficient d.......... This is similar to as many data points as possible. k Med-Med Graph When...

Software User Guide
Page 211
... A = In a, the formula corresponds to linear regression formula y = a + bX. 1(CALC)6(g)2(Log) 6(DRAW) The following is the exponential regression model formula. The standard exponential regression formula is the logarithmic regression model formula. k Logarithmic Regression Graph Logarithmic regression expresses y as a proportion of the exponential function of x. y = a + b·ln x a regression constant term b regression coefficient k Exponential Regression Graph Exponential regression expresses y as a logarithmic function of...
... A = In a, the formula corresponds to linear regression formula y = a + bX. 1(CALC)6(g)2(Log) 6(DRAW) The following is the exponential regression model formula. The standard exponential regression formula is the logarithmic regression model formula. k Logarithmic Regression Graph Logarithmic regression expresses y as a proportion of the exponential function of x. y = a + b·ln x a regression constant term b regression coefficient k Exponential Regression Graph Exponential regression expresses y as a logarithmic function of...

Software User Guide
Page 212
...y = a·sin(bx + c) + d 1(CALC)6(g)5(Sin) 6(DRAW) Drawing a sine regression graph causes the angle unit setting of the calculator to automatically change when you perform a sine regression calculation without drawing a graph. • Certain types of data may take the logarithm of x.... This does not indicate malfunction. 6-19 The angle unit does not change to linear regression formula Y = A + bX. 1(CALC)6(g)4(Power) 6(DRAW) The following is best applied for cyclical data. k Power Regression Graph Power regression expresses y as a proportion of the power of both sides we get In...
...y = a·sin(bx + c) + d 1(CALC)6(g)5(Sin) 6(DRAW) Drawing a sine regression graph causes the angle unit setting of the calculator to automatically change when you perform a sine regression calculation without drawing a graph. • Certain types of data may take the logarithm of x.... This does not indicate malfunction. 6-19 The angle unit does not change to linear regression formula Y = A + bX. 1(CALC)6(g)4(Power) 6(DRAW) The following is best applied for cyclical data. k Power Regression Graph Power regression expresses y as a proportion of the power of both sides we get In...

Software User Guide
Page 216
...; {ax+b}/{a+bx}/{Med}/{X2}/{X3}/{X4}/{Log}/{aebx}/{abx}/{Power}/{Sin}/{Logistic} ... {linear regression (ax+b form)}/{linear regression (a+bx form)}/{Med-Med}/{quadratic regression}/{cubic regression}/{quartic regression}/{logarithmic regression}/{exponential regression (aebx form)}/{exponential regression (abx form)}/{power regression}/ {sinusoidal regression}/{logistic regression} parameters Example To display single-variable regression parameters 2(CALC)3(REG)1(X)1(ax+b) The meanings of the parameters that appear on the...
...; {ax+b}/{a+bx}/{Med}/{X2}/{X3}/{X4}/{Log}/{aebx}/{abx}/{Power}/{Sin}/{Logistic} ... {linear regression (ax+b form)}/{linear regression (a+bx form)}/{Med-Med}/{quadratic regression}/{cubic regression}/{quartic regression}/{logarithmic regression}/{exponential regression (aebx form)}/{exponential regression (abx form)}/{power regression}/ {sinusoidal regression}/{logistic regression} parameters Example To display single-variable regression parameters 2(CALC)3(REG)1(X)1(ax+b) The meanings of the parameters that appear on the...

Software User Guide
Page 217
... following : linear regression, logarithmic regression, exponential regression, or power regression calculation. Correlation coefficient (r) Displayed following parameters also appear on the regression calculation type, mean square error (MSe) is obtained using the following any regression calculation except Med-Med. u Calculation of the Correlation Coefficient (r), Coefficient of determination (r2) Displayed following: linear regression, quadratic regression, cubic regression, quartic regression, logarithmic regression, exponential regression, power regression calculation. Coefficient...
... following : linear regression, logarithmic regression, exponential regression, or power regression calculation. Correlation coefficient (r) Displayed following parameters also appear on the regression calculation type, mean square error (MSe) is obtained using the following any regression calculation except Med-Med. u Calculation of the Correlation Coefficient (r), Coefficient of determination (r2) Displayed following: linear regression, quadratic regression, cubic regression, quartic regression, logarithmic regression, exponential regression, power regression calculation. Coefficient...

Software User Guide
Page 219
... The estimated value xˆ is displayed for xi = 20. Input data into the list and draw the linear regression graph. 3. From the Main Menu, enter the Statistics mode. 2. baaa(value of a regression calculation. ca(value of ţ and xů when xi = 20 and yi = 1000 xi 10 15... drawing a statistical graph (such as Scatter Plot), the Statistics mode also has a function that lets you copy the regression formula obtained as follows. Example To perform a linear regression using the nearby data and estimate the values of xi) K5(STAT)2(ţ)w The estimated value ţ is displayed...
... The estimated value xˆ is displayed for xi = 20. Input data into the list and draw the linear regression graph. 3. From the Main Menu, enter the Statistics mode. 2. baaa(value of a regression calculation. ca(value of ţ and xů when xi = 20 and yi = 1000 xi 10 15... drawing a statistical graph (such as Scatter Plot), the Statistics mode also has a function that lets you copy the regression formula obtained as follows. Example To perform a linear regression using the nearby data and estimate the values of xi) K5(STAT)2(ţ)w The estimated value ţ is displayed...

Software User Guide
Page 321
... 2, Blue • The following is a typical graph condition specification for a logistic regression graph. ExpReg(a·eˆbx) Quadratic Regression .... Cubic Power Regression Power Quartic Regression ........ S-Gph1 DrawOn, Sinusoidal, List 1, List 2, Blue • The following is a typical graph condition specification for a pie chart. Linear Logarithmic Regression ...... Linear Regression .......... S-Gph1 DrawOn, Pie, List 1, %, None, ColorLinkOff, ColorAuto ColorLighter, ColorClr • The...
... 2, Blue • The following is a typical graph condition specification for a logistic regression graph. ExpReg(a·eˆbx) Quadratic Regression .... Cubic Power Regression Power Quartic Regression ........ S-Gph1 DrawOn, Sinusoidal, List 1, List 2, Blue • The following is a typical graph condition specification for a pie chart. Linear Logarithmic Regression ...... Linear Regression .......... S-Gph1 DrawOn, Pie, List 1, %, None, ColorLinkOff, ColorAuto ColorLighter, ColorClr • The...

Software User Guide
Page 324
... as the calculation type. LinearReg(ax+b)......linear regression (ax+b type) LinearReg(a+bx)......linear regression (a+bx type) Med-MedLine ..........Med-Med calculation QuadReg quadratic regression CubicReg cubic regression QuartReg quartic regression LogReg logarithmic regression ExpReg(a·eˆbx)........exponential regression (a·ebx type) ExpReg(a·bˆx)..........exponential regression (a·bx type) PowerReg power regression • Sinusoidal regression statistical calculation SinReg List 1, List 2 y-axis...
... as the calculation type. LinearReg(ax+b)......linear regression (ax+b type) LinearReg(a+bx)......linear regression (a+bx type) Med-MedLine ..........Med-Med calculation QuadReg quadratic regression CubicReg cubic regression QuartReg quartic regression LogReg logarithmic regression ExpReg(a·eˆbx)........exponential regression (a·ebx type) ExpReg(a·bˆx)..........exponential regression (a·bx type) PowerReg power regression • Sinusoidal regression statistical calculation SinReg List 1, List 2 y-axis...

Software User Guide
Page 330
... to variables z, p, o1, o2, n1, n2 and to ListAns elements 1 through 9. Note: Specify 0 when you want to ListAns elements 1 through 6. LinRegTTest: Syntax: Output Values: Executes linear regression t-test calculation. Syntax: TwoSampleZTest "ƫ1 condition", σ1, σ2, List1, List2[, Freq1 [, Freq2]] Output Values: z, p, o1, o2, sx1, sx2, n1, n2 are assigned respectively to variables...
... to variables z, p, o1, o2, n1, n2 and to ListAns elements 1 through 9. Note: Specify 0 when you want to ListAns elements 1 through 6. LinRegTTest: Syntax: Output Values: Executes linear regression t-test calculation. Syntax: TwoSampleZTest "ƫ1 condition", σ1, σ2, List1, List2[, Freq1 [, Freq2]] Output Values: z, p, o1, o2, sx1, sx2, n1, n2 are assigned respectively to variables...

Software User Guide
Page 589
... series expansion may not align correctly with the calculation result. 7. The same general steps can use the procedure below to perform quadratic regression. Input a value in the range of 1 to perform the other types of this happens, shift the position the original graph to... move the original graph, see if they are supported: Linear, Med-Med, Quadratic, Cubic, Quartic, Logarithmic, Exponential, Power, Sine, and Logistic. k Performing Regression You can also be used to 10, and then press w. • The graph relation list ...
... series expansion may not align correctly with the calculation result. 7. The same general steps can use the procedure below to perform quadratic regression. Input a value in the range of 1 to perform the other types of this happens, shift the position the original graph to... move the original graph, see if they are supported: Linear, Med-Med, Quadratic, Cubic, Quartic, Logarithmic, Exponential, Power, Sine, and Logistic. k Performing Regression You can also be used to 10, and then press w. • The graph relation list ...


