User Guide
Page 49
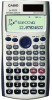
... the STAT editor screen. Deleting All STAT Editor Contents (1) Press 11(STAT)3(Edit). (2) Press 2(Del-A). • This clears all of commands for calculating the mean, standard deviation, etc.
... the STAT editor screen. Deleting All STAT Editor Contents (1) Press 11(STAT)3(Edit). (2) Press 2(Del-A). • This clears all of commands for calculating the mean, standard deviation, etc.
User Guide
Page 50
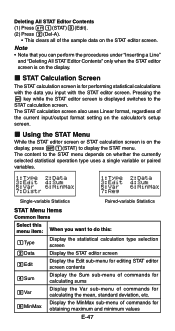
...)) Select this menu item: When you want to obtain this: 1n 2o 3xσn 4xσn-1 Number of samples Mean of the sample data Population standard deviation Sample standard deviation MinMax Sub-menu (11(STAT)6(MinMax)) Select this menu item: 1minX 2maxX When you want to obtain this : 7Distr Display the Distr sub-menu...
...)) Select this menu item: When you want to obtain this: 1n 2o 3xσn 4xσn-1 Number of samples Mean of the sample data Population standard deviation Sample standard deviation MinMax Sub-menu (11(STAT)6(MinMax)) Select this menu item: 1minX 2maxX When you want to obtain this : 7Distr Display the Distr sub-menu...
User Guide
Page 51
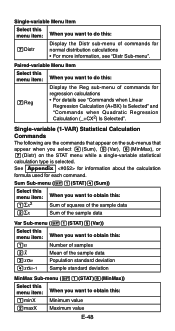
... (1-VAR) and input the following data: {1, 2, 3, 4, 5, 6, 7, 8, 9, 10} (FREQ: ON) Edit the data to the following, using the mean , and population standard deviation. Calculate sum of squares of the sample data and sum of standard normal distribution. Normalized variate t is 7 (R value for normalized variate when X = 7) E-49 Distr Sub-menu (11(STAT)7(Distr)) 1 P( 2 Q( 3 R( 4 't This menu...
... (1-VAR) and input the following data: {1, 2, 3, 4, 5, 6, 7, 8, 9, 10} (FREQ: ON) Edit the data to the following, using the mean , and population standard deviation. Calculate sum of squares of the sample data and sum of standard normal distribution. Normalized variate t is 7 (R value for normalized variate when X = 7) E-49 Distr Sub-menu (11(STAT)7(Distr)) 1 P( 2 Q( 3 R( 4 't This menu...
User Guide
Page 52
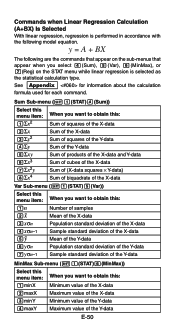
... 3xσn 4xσn-1 5p 6yσn 7yσn-1 Number of samples Mean of the X-data Population standard deviation of the X-data Sample standard deviation of the X-data Mean of the Y-data Population standard deviation of the Y-data Sample standard deviation of the Y-data MinMax Sub-menu (11(STAT)6(MinMax)) Select this : 1minX Minimum value of the X-data...
... 3xσn 4xσn-1 5p 6yσn 7yσn-1 Number of samples Mean of the X-data Population standard deviation of the X-data Sample standard deviation of the X-data Mean of the Y-data Population standard deviation of the Y-data Sample standard deviation of the Y-data MinMax Sub-menu (11(STAT)6(MinMax)) Select this : 1minX Minimum value of the X-data...
User Guide
Page 53
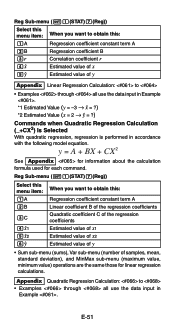
... want to obtain this : 1A Regression coefficient constant term A 2B Regression coefficient B 3r 4m 5n Correlation coefficient r Estimated value of x Estimated value of samples, mean, standard deviation), and MinMax sub-menu (maximum value, minimum value) operations are the same those for each command. Appendix Quadratic Regression Calculation: to obtain this : Regression coefficient...
... want to obtain this : 1A Regression coefficient constant term A 2B Regression coefficient B 3r 4m 5n Correlation coefficient r Estimated value of x Estimated value of samples, mean, standard deviation), and MinMax sub-menu (maximum value, minimum value) operations are the same those for each command. Appendix Quadratic Regression Calculation: to obtain this : Regression coefficient...


